


 400 998 0226
 Tableau


 Tableau
 Minitab


 Alteryx


 Neo4j
Neo4j


 Talend


 IM
IM


 华为云
华为云 腾讯云
腾讯云 IT/安全
IT/安全


Lift a chestnut! Tableau Trise (133): Complete Display Data in Tool Tips
In the actual analysis scenario, data powder may be skilled using a Sambi map or a Pareto to analyze the data, but often scratch the because some small details cannot be achieved.
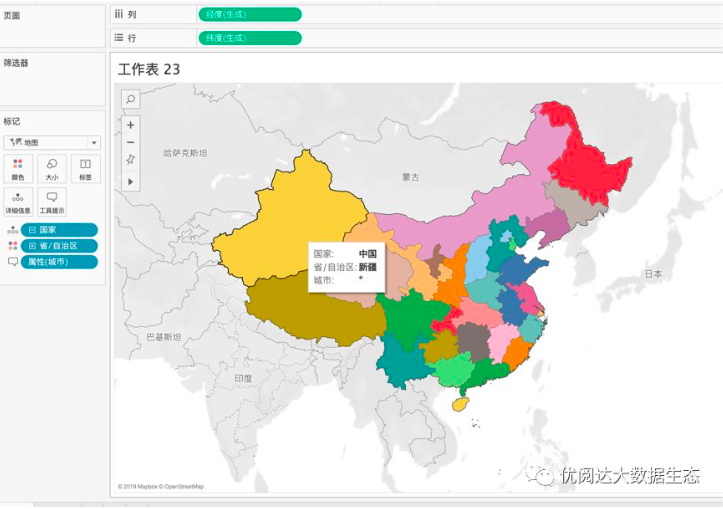
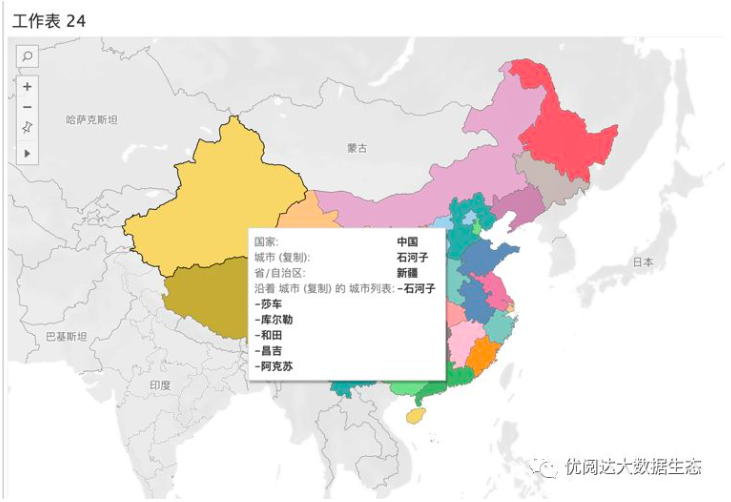
For example, this need to be told today: Map analysis, the province and city contain multiple cities. Stay the mouse in a province, in the tooltip column, the city is displayed as * (as shown below). However, most users are more desirable, and all cities in the province data can be displayed here.
So how do you achieve the desired presented effect? Today will solve this problem.
The Tableau trick we want to share with you this issue is: Complete the data in the tooltips.
For the convenience of learning, chestnuts use Tableau to own the "example-supermarket" data source. After mastering the chestnut method, the data powder can try to use its own data.
Specific steps are as follows:
1. Open Tableau Desktop, connect "Example - Supermarket" data source, and create a new worksheet.
In the "Data" pane, right click on the dimension "National" and "Province / Autonomous Region", in the drop-down menu, choose "Geographic Role" - Country / Region and "Geographic Role" - "Province / City / Autonomous Region" .

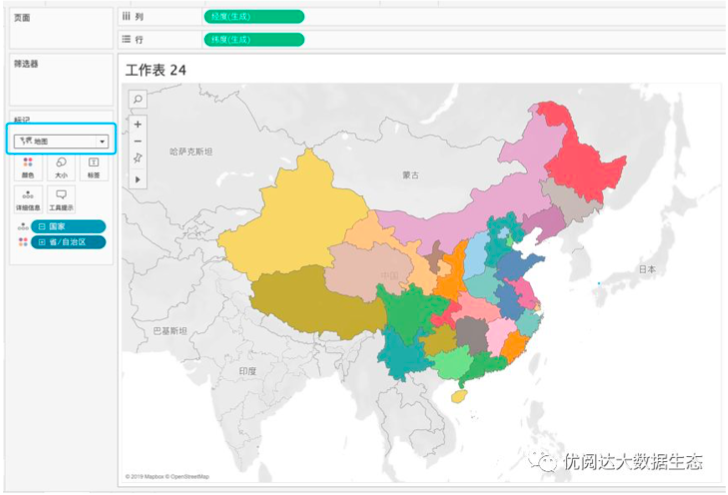
2. Drag and drop the conversion geographic role "Country" Drag and drop to the "Tag" card, drag and drop the "province / city / autonomous zone" into the color of the "Mark" card, and select the tag type as: map.
In the "Data" pane, right click on the dimension "City" and select "Copy" in the drop-down menu. Right-click the "City" (copy) "just copied, select" Change Data Type "in the drop-down menu -" String ".

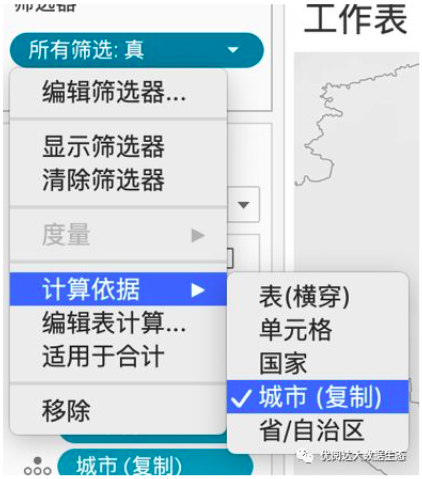
3. Right-click on the "Data" pane, select "Create" - "Calculate Field". Rename the calculated field: All Filters, Type Functions: Index () = Size ()
Tips: Index is the index of the current row, and size represents all rows, this field is the judgment of all cities.

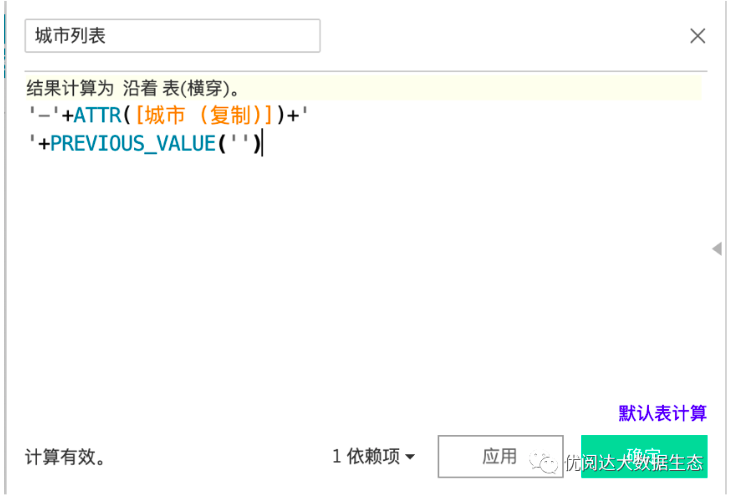
Repeat the above steps, create a calculation field: city list, type function:
'-' + Attr ([Cast (copy)]) + '' + previous_value ('')
4, drag and drop the dimension "City" drag and drop to the "Tag" card;
Drag and drop the Calculate Field "City List" to the Tool Tip of the Tags card. Right click on "Mark" card "City List" capsules, select "Calculate" - "City (Copy)" in the drop-down menu;
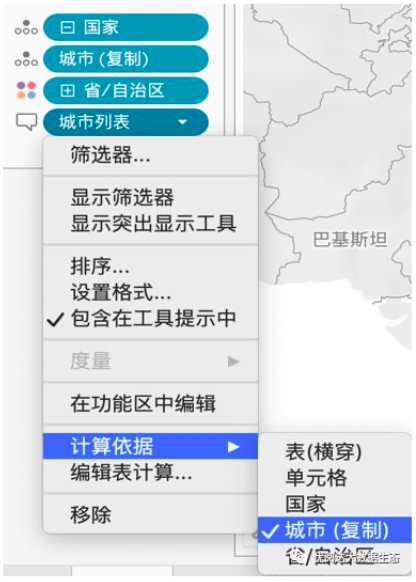
Drag and drop the calculation field "All Filters" to the filter, right-click the "true" capsule, select "calculation basis" - "City (copy)".
After completing the above steps, the mouse stays on any province of the map, in its toolpar, all city names corresponding to the province data will be displayed.
Chestnut Tips Tableau 10.5
And the above version of the user, if the amount of data is small, you can also use the tool prompt visualization function, insert the worksheet in the tool prompt to implement the chestnut effect. However, because there is no scroll bar in the tooltip bar, all information cannot be displayed if the large worksheet is inserted. In this case, the method of this chestnut is required.
This issue of Tableau skills, have you get? Try it quickly!