SuperTables
Discover interactive Excel-like tables and allow users to deci
Products
Data Consumption
Talbeau Extensions
SuperTables
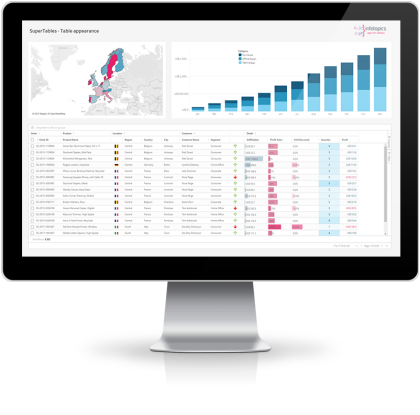
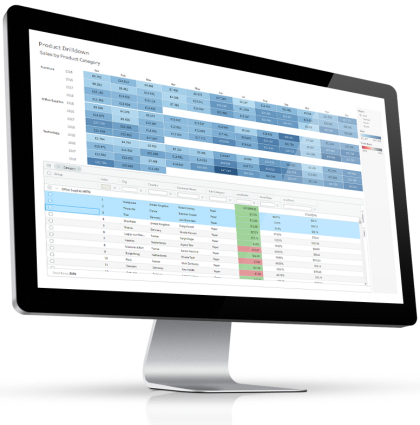
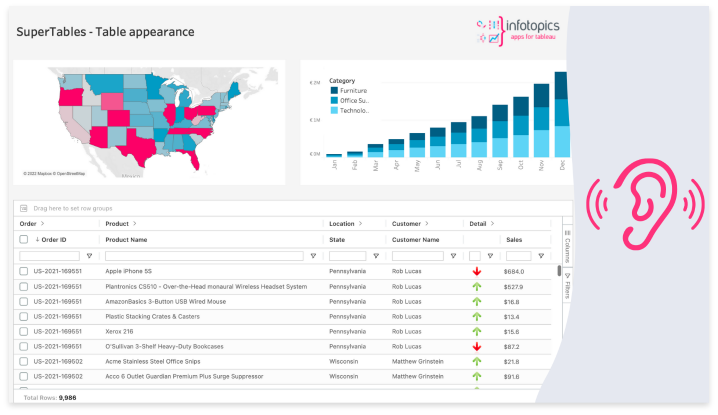
With the SuperTables extension for Tableau, you can offer your dashboard users the power of interactive and dynamic Excel-like tables that allow users to decide how to organize and analyze their data in a flexible grid using the features just like in Excel without leaving Tableau! Enrich your dashboards with the SuperTables extension for Tableau and allow your visitors to do their own analysis with the summarized data of your visualizations.
Countless features
Inline Filter
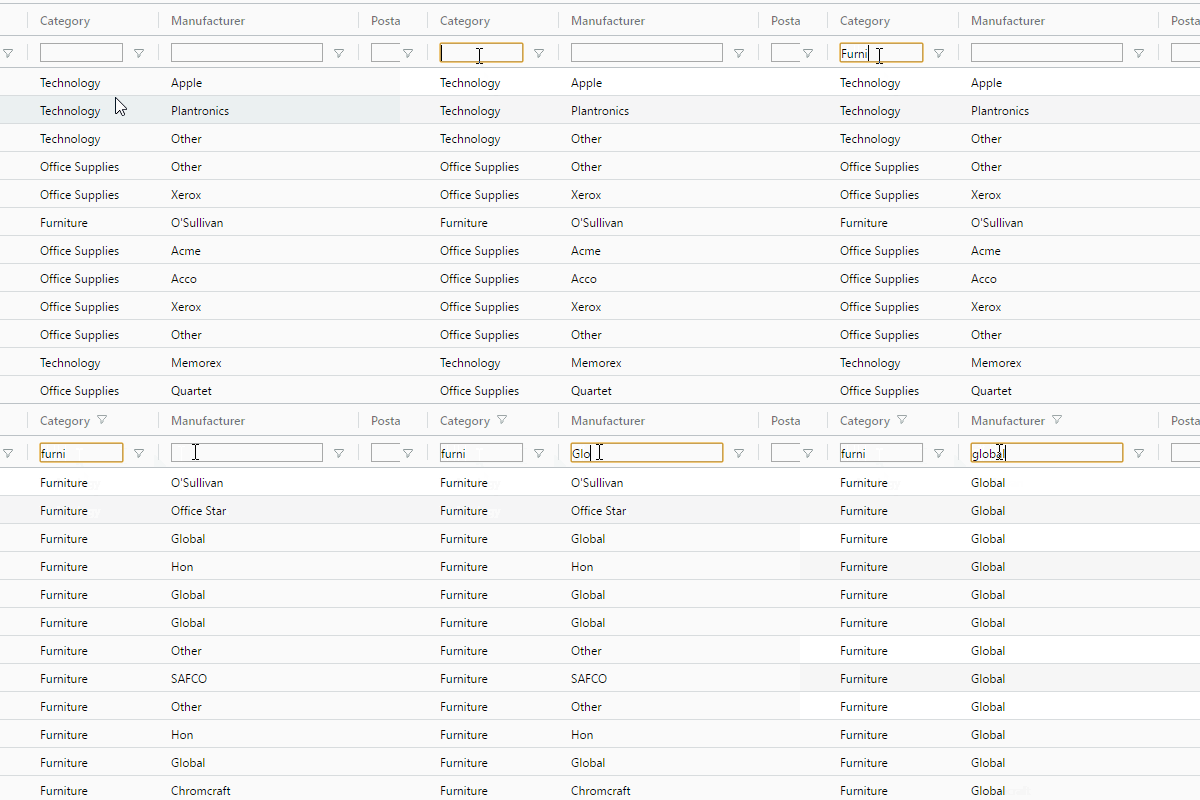
SuperTables comes with an extensive set of built-in column filter types. You can also filter by all columns simultaneously with quick filtering.
Easy Grouping
Let your users explore the data. SuperTables allows the dashboard user to group by specific columns. Optionally, you can display various aggregate column values in the grouped row.
Autosize Columns
Just one click and the width of your column will fit the content it contains. Get enough space to watch your data!
Aggregate Calculations
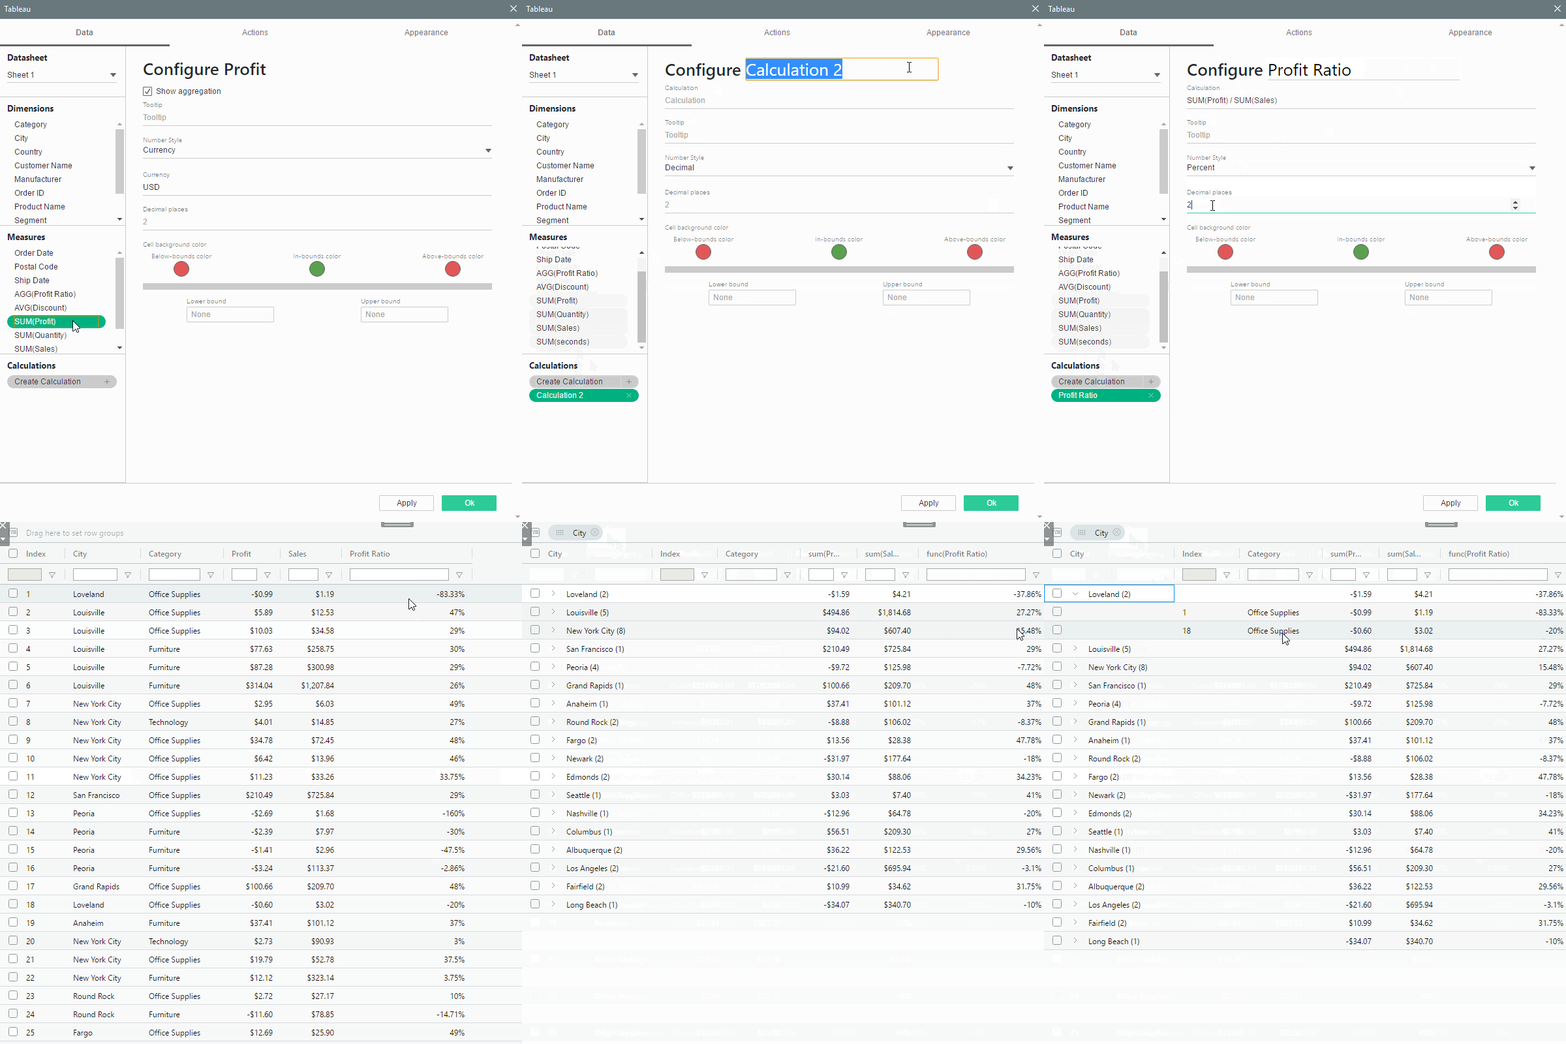
Your calculations will be on summarized data or row level, you choose! To calculate ratio?s your data has to be summarized before calculated.
Export to Excel & CSV
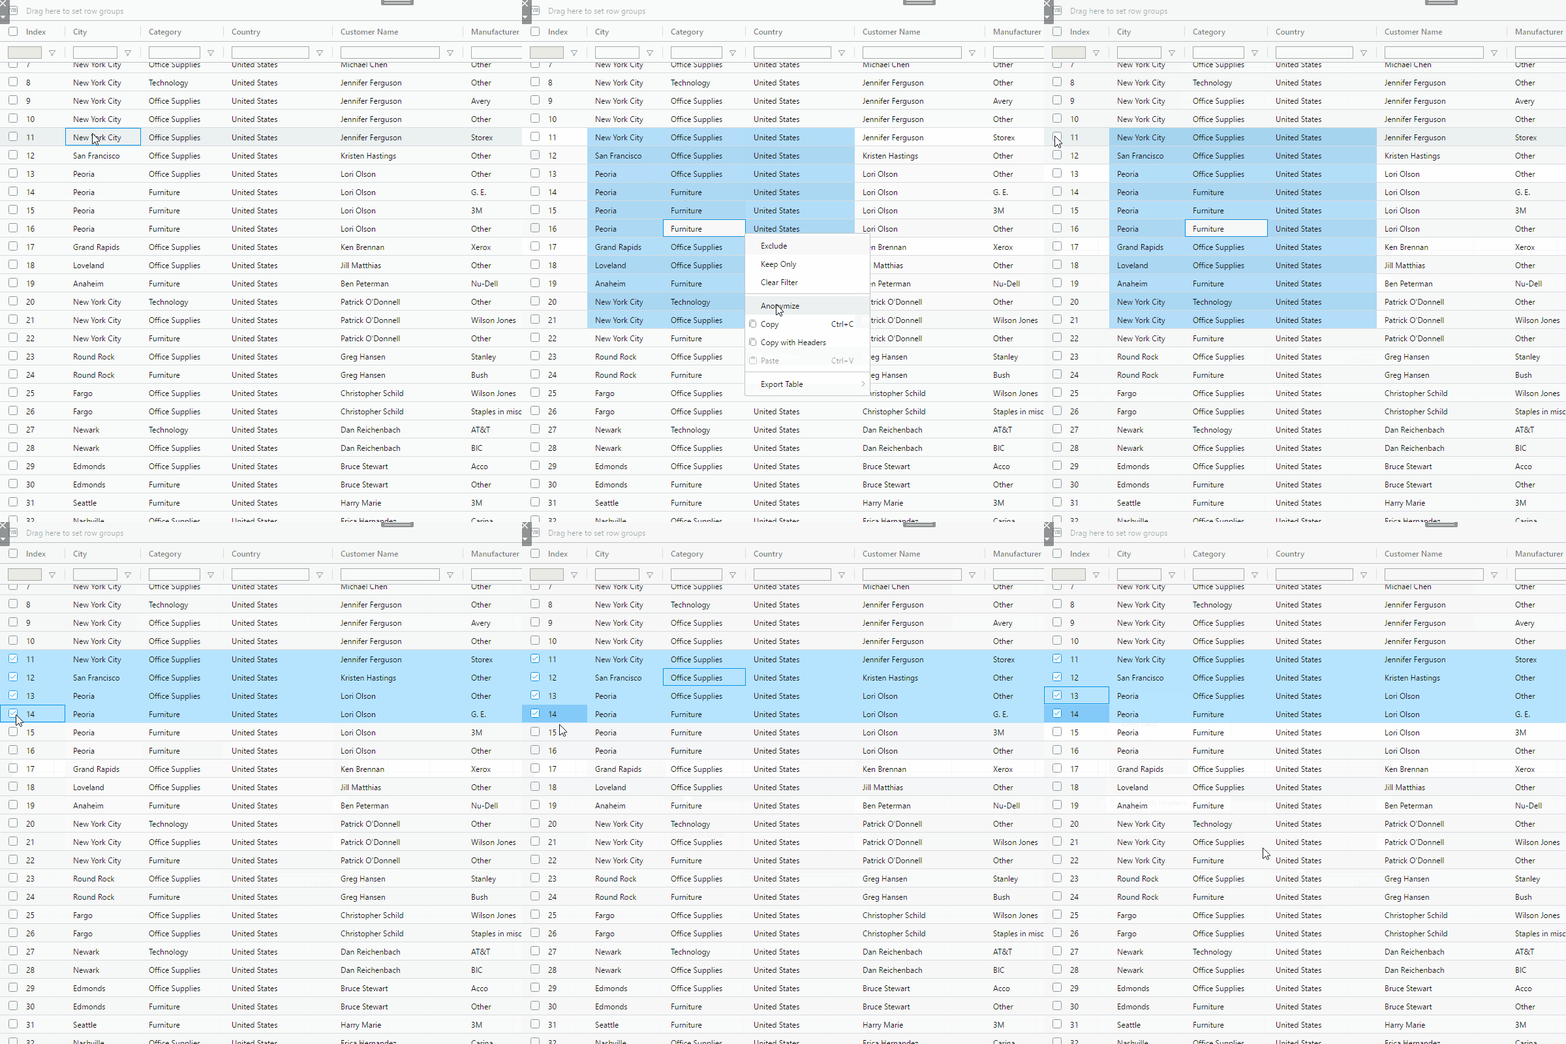
Let your users export data to CSV or Excel file format right from the SuperTables extension. The excel format preserves the styling.
Full Drill-Down
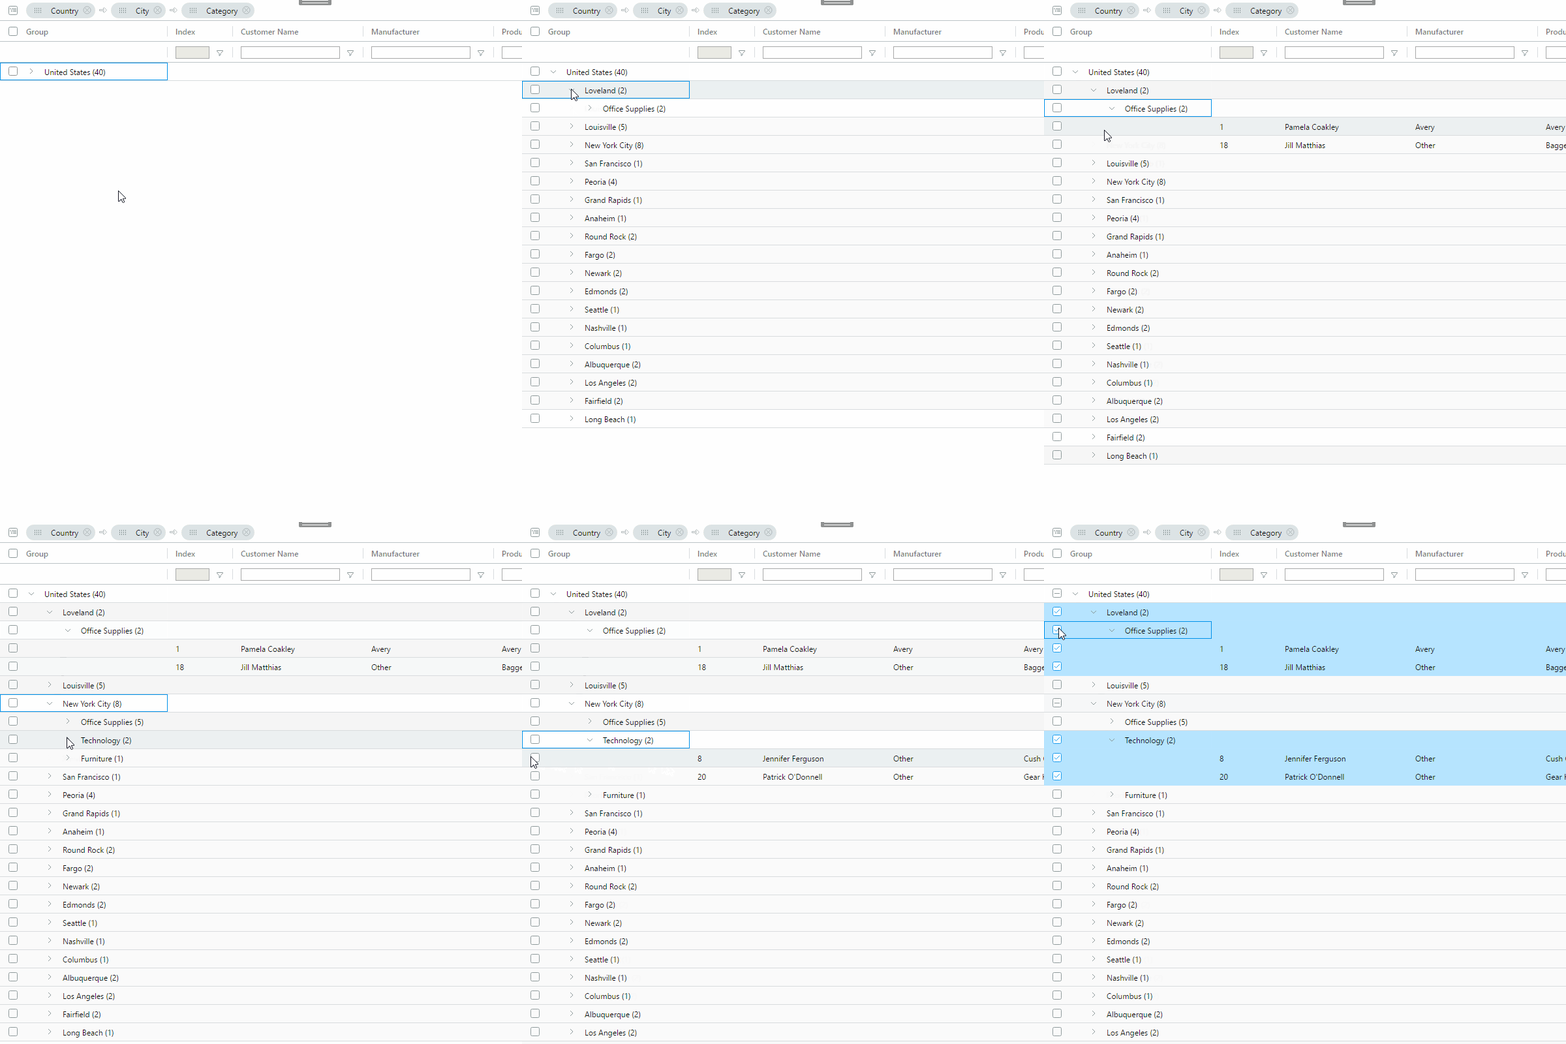
The drill-down option of SuperTables allows your users to expand rows and have an additional grid with different columns inside for further analysis.
There is more!
  • Filter, Parameter and Highlight Actions
  • Conditional cell formatting
  • Header grouping
  • Prefix and suffix
  • Tooltips for headers
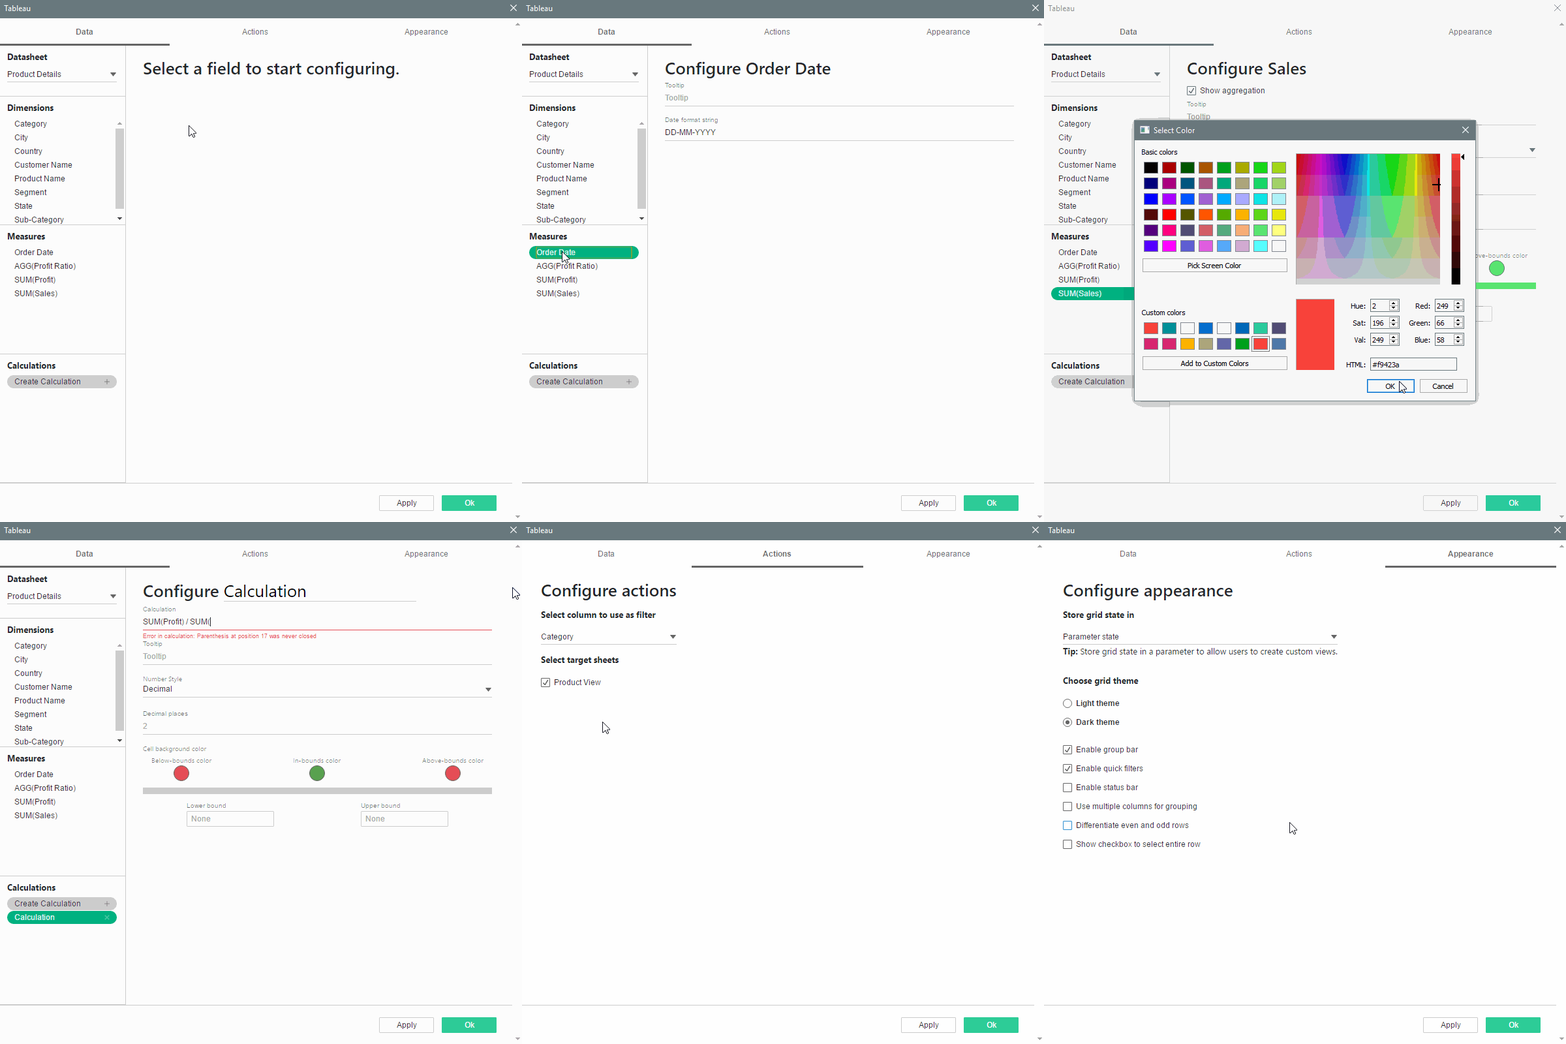
Using a table in your dashboard comes in handy if you want to provide your dashboard users with extra context on their visualization. Drag the SupertTables solution to your dashboard, configure the data(sheet) to feed the table and provide your dashboard users with some amazing details. You?ve never seen a more powerful table!
Pivot your Table
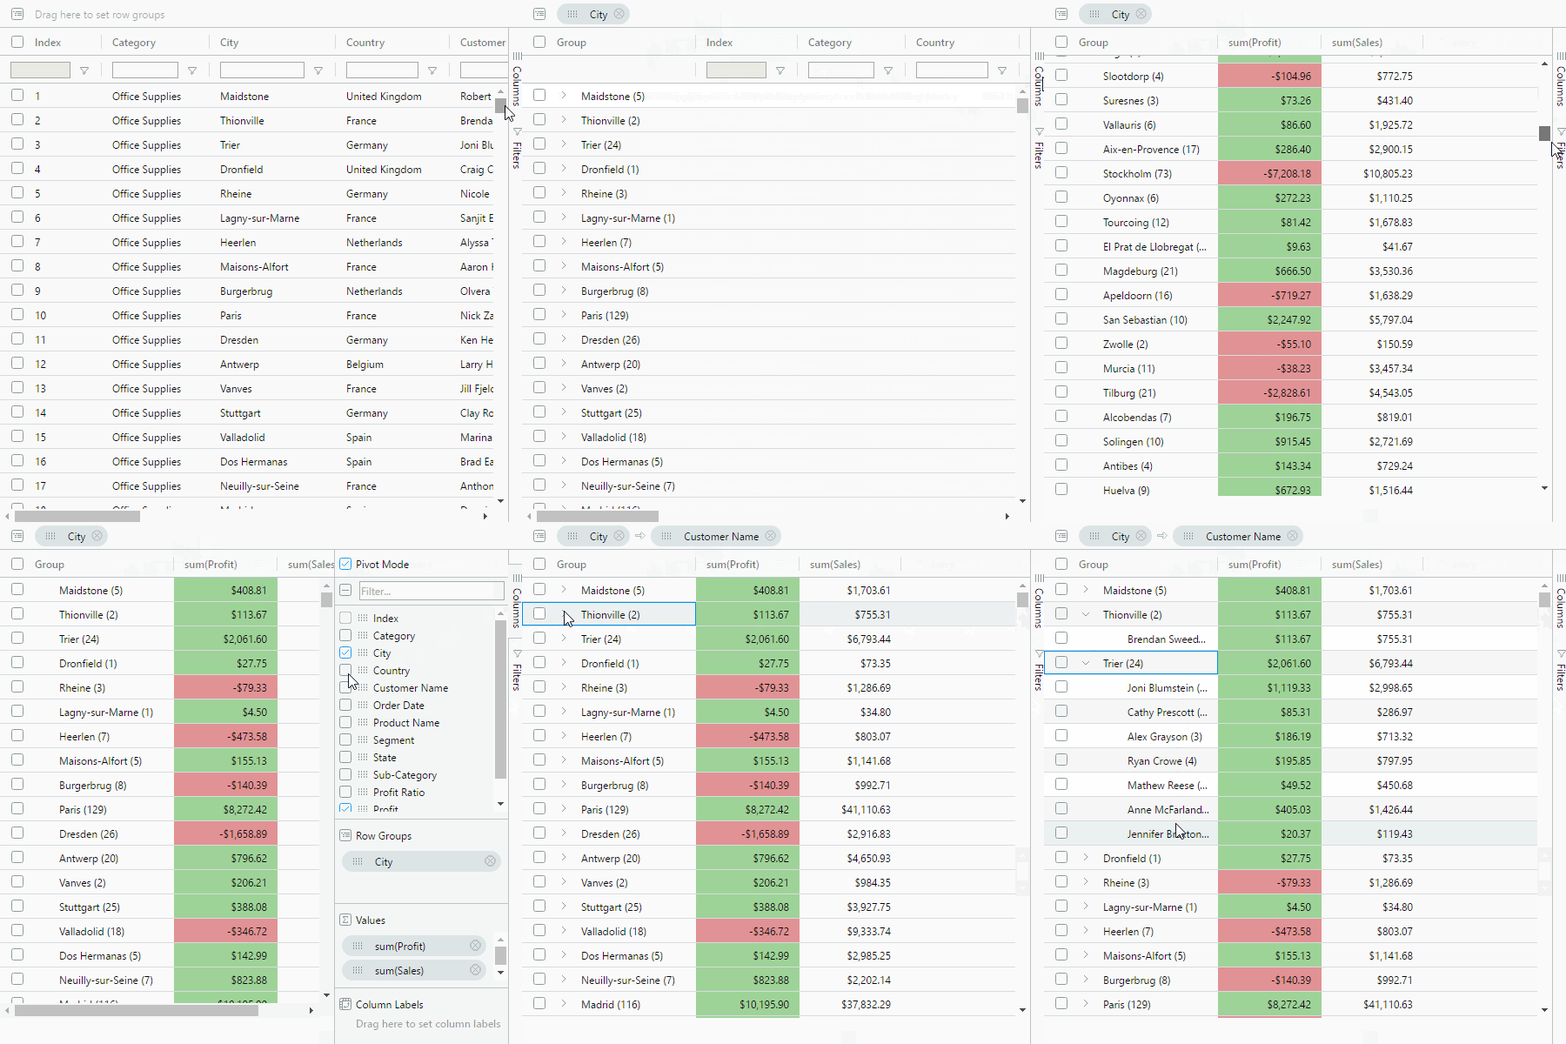
Empower your advanced dashboard users! Let them make columns out of values by pivoting on the data right in your table, similar to Pivot Tables in Excel.
Customized Views
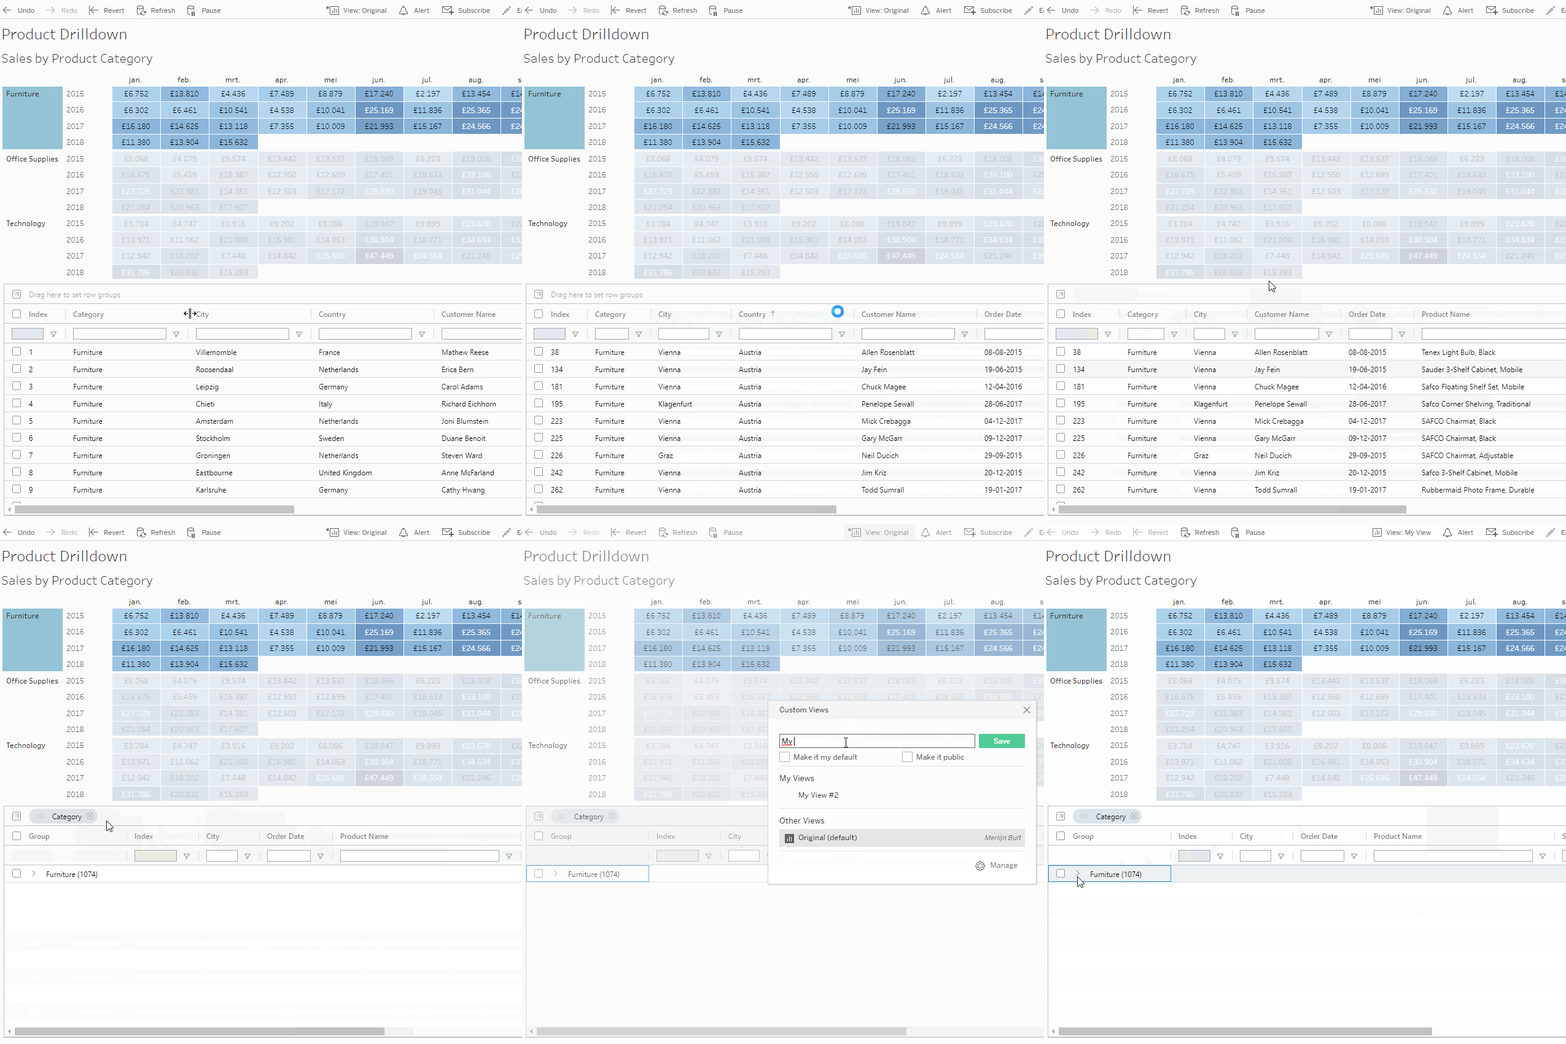
Let your users resume their work from where they left. SuperTables lets you save and restore the user?s table preferences, including filtering, sorting and column order/visibility.
Dashboard Actions
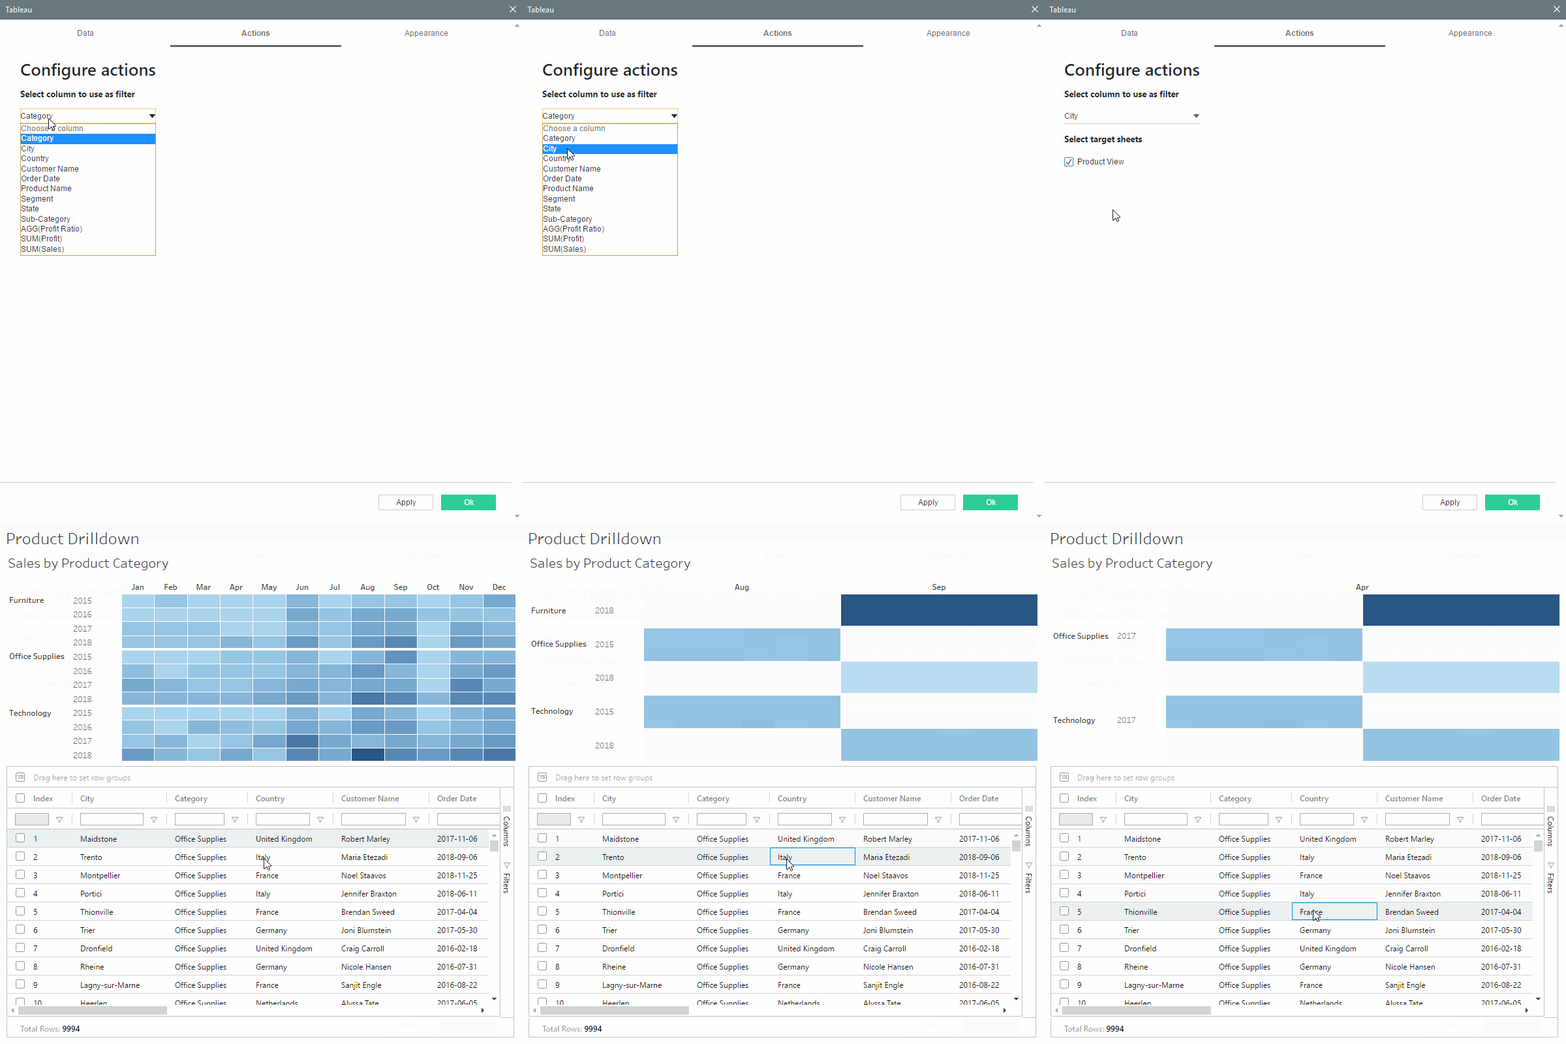
Your SuperTable has a two way interaction with other sheets in your dashboard. Configure what sheets you want to interact with.
Design Themes
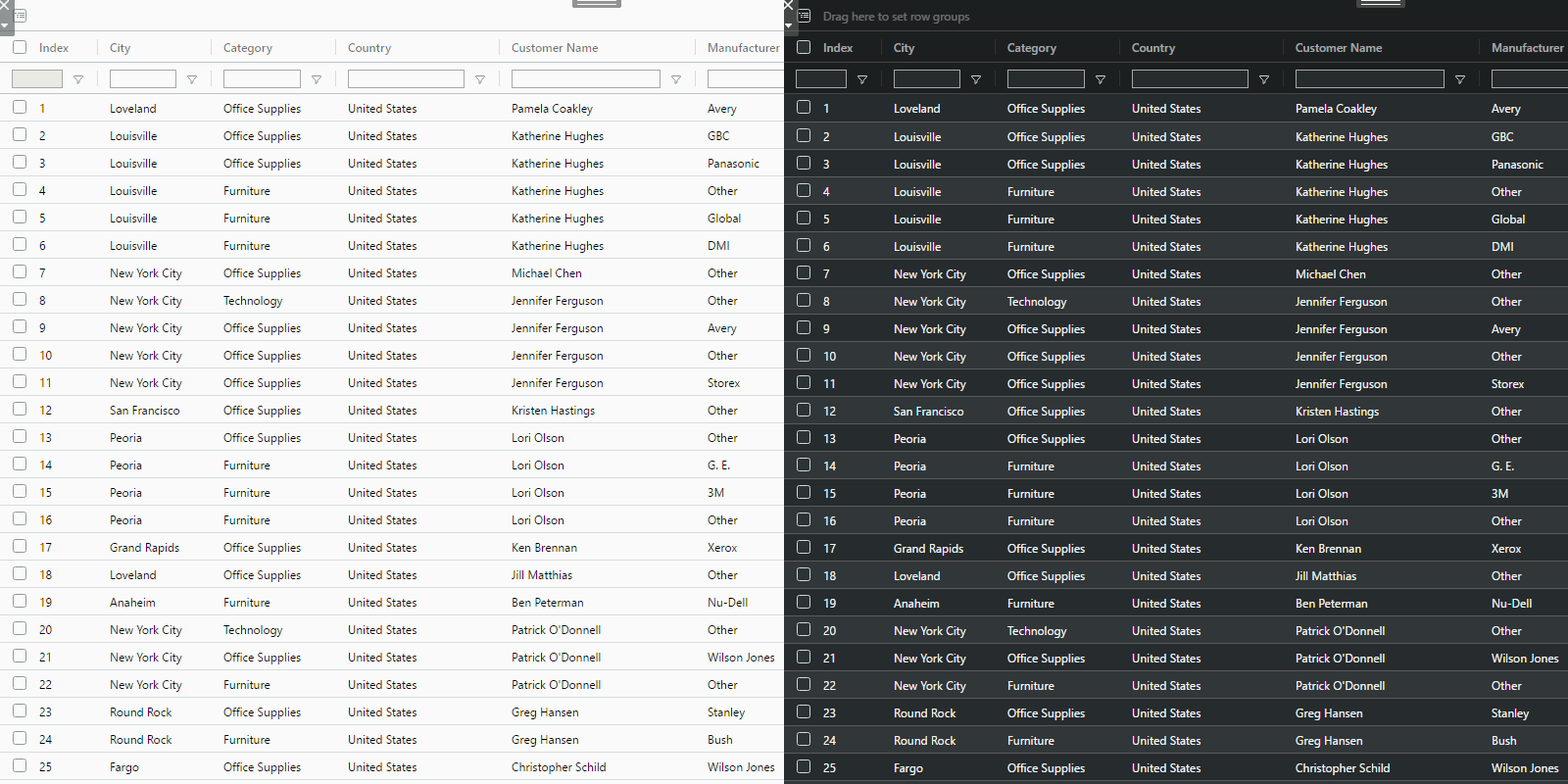
SuperTables comes default with a light and dark theme to fit your dashboard design. Besides the Tableau markup Supertables also enables you to rich format your dimensions and measures.
Smooth Performance
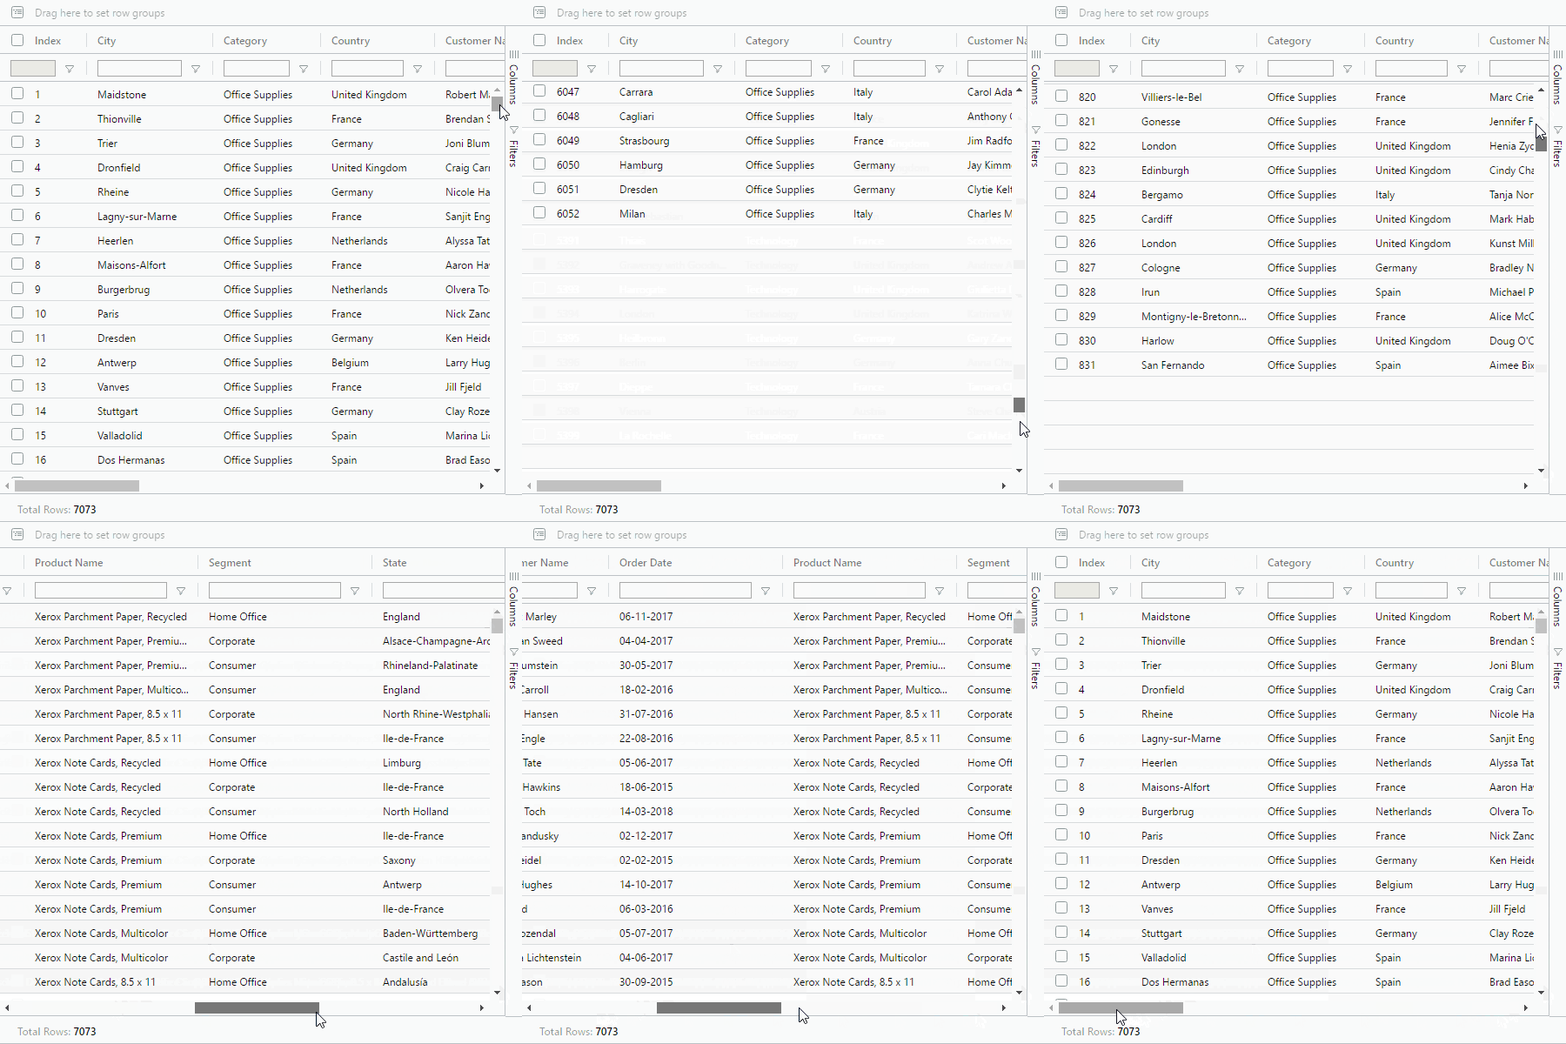
Out of the box, SuperTables is designed to perform smoothly with millions of records. No specific configuration required, lazy loading is integrated.
Awesome UI
SuperTables uses native Tableau user interface elements and exposes its features through several modules ? column headers and menus, context menu, tool panel, and status bar.
NEW: Enhanced Accessibility Mode
With enhanced accessibility mode all rows and columns will be rendered even if they are not visible in the screen. This makes using SuperTables with screen readers seamless. Animations will be disabled when using enhanced mode as it is complex to use scree