


 400 998 0226
 Tableau


 Tableau
 Minitab


 Alteryx


 Neo4j
Neo4j


 Talend


 IM
IM


 华为云
华为云 腾讯云
腾讯云 IT/安全
IT/安全


JSON 文件
- 版本 :2022.1 及更高版本
本文介绍如何将 Tableau 连接到本地 JSON 文件并设置数据源。
建立连接并设置数据源
启动 Tableau,然后在“连接”下,选择“JSON 文件”。然后执行以下操作:
选择要连接到的文件,然后选择“打开”。
在“选择架构级别”对话框中,选择要在 Tableau 中查看和分析的架构级别,然后选择“确定”。有关详细信息,请参阅选择架构级别。
在数据源页面上,执行以下操作:
(可选)选择页面顶部的默认数据源名称,然后输入要在 Tableau 中使用的唯一数据源名称。例如,使用数据源命名约定,帮助数据源的其他用户确定要连接到哪个数据源。
选择工作表选项卡以开始分析。
JSON 文件数据源示例
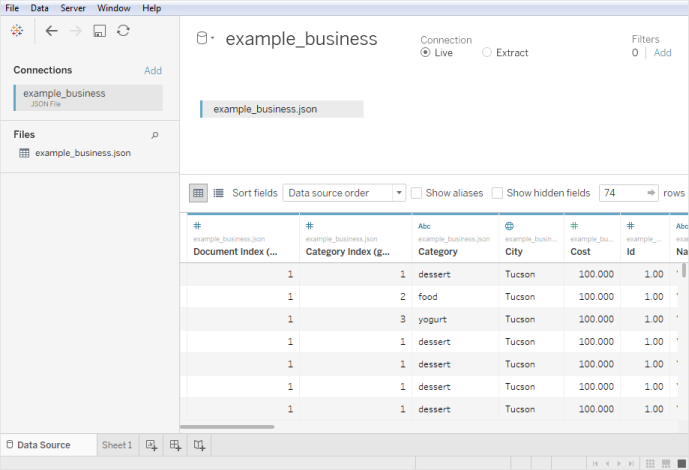
下面是在 Windows 计算机上使用 Tableau Desktop 作为数据源的 JSON 文件的示例:
选择架构级别
将 Tableau 连接到 JSON 文件时,Tableau 会扫描 JSON 文件的前 10,000 行中的数据,并从该进程推断架构。Tableau 使用此推断的架构拼合数据。JSON 文件架构级别在“选择架构级别”对话框中列出。在 Tableau Desktop 中,如果 JSON 文件的行数超过 10,000 行,则可以使用“扫描整个文档”选项创建架构。
注意:“扫描整个文档”选项仅对行数超过 10,000 行的 JSON 文件显示。它在网络上不可用。
您在对话框中选择的架构级别决定了哪些维度和度量值可供您在 Tableau 中查看和分析。它们还确定要发布哪些数据。
注意:将工作簿发布到 Web 时,任何架构更新都不适用于 Web 版本的可视化,并且如果随后刷新可视化,则可能会导致错误
如果选择子架构级别,则还会选择父级别。
| 例如,下面是一个 JSON 文件的代码段: | JSON 文件生成以下架构级别: |
 |  |
Detect new fields
Sometimes, more fields exist in rows that were not scanned to create the inferred schema. If you notice that a field you need is missing under Schema, you can choose to do one of the following:
Scan the entire JSON document. It may take a long time for the scan to complete.
Select schema levels from the schema listed and then select OK. Tableau reads your entire document and if more fields are found, they are listed in the Select Schema Levels dialog box.
Whenever Tableau detects that new fields are available, for example, during an extract refresh or when Tableau creates an extract after you’ve selected the schema levels, either an information icon near the file name or a notification on the Select Schema Levels dialog box will indicate that additional fields have been found.
Change schema levels
You can change the schema levels you selected by going to the data source page and selecting Data > [JSON file name] > Select Schema Level. Or, hover over the file name on the canvas and select the drop-down menu > Select Schema Level.
Union JSON files
You can union JSON data. To union a JSON file, it must have a .json, .txt, or .log extension. For more information about union, see Union Your Data.
When you union JSON files, the schema is inferred from the first 10,000 rows of every file in the union.
You can change the schema levels after you union files. For more information, see Change schema levels.
How dimension folders are organized for hierarchical JSON files
After you select the sheet tab, the selected schema levels of your JSON file show under Dimensions on the Data pane. Each folder corresponds with the schema level you selected, and the attributes associated with that schema level are listed as children of the folder.
For example, in the following image, Address is a dimension under the schema level Businesses folder. Categories is also a schema level, but because it is a list of values and not a hierarchy of data, it doesn't require its own folder, but is instead grouped under a parent folder. Note that schema levels in the Select Schema Levels dialog box do not map directly to the folder structure in the Data pane. Folders in the Data pane are grouped by object so that you can easily navigate to fields and still have context for where the fields come from.
For each document, a unique index is generated and stored in the flattened representation of data. An index is also generated for each level in the schema.
For example, in the image above, in addition to the Document Index (generated) entry, the Attribute and Hours schema levels all have generated indexes.
Why measures are calculated in hierarchical JSON files
When a hierarchical JSON file is flattened, data might be duplicated. To keep measures consistent with their schema levels, Tableau creates level of detail (LOD) calculations to accurately represent the data at the schema level. The original measures are located in the Source Measures folder and you can use them, but we recommend that you use the calculated measures.
On the Data pane, calculated measures are labeled as Number of.
To view the LOD calculation for a measure, follow these steps:
Select the measure.
Select the drop-down arrow, and then select Edit.
The following example shows the LOD calculation for Revenue per Document. The formula selects the maximum revenue for each document index value.
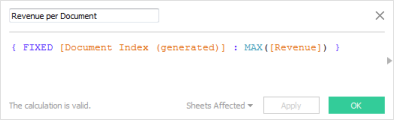
The use of LOD calculations means that you can select multiple schema levels and be confident that the measures are not over-counted.
Tips for working with JSON data
These tips can help you work with your JSON data in Tableau.
Do not exceed the 10x10 limit for nested arrays.
A high number of nested arrays creates a lot of rows. For example, 10x10 nested arrays result in 10 billion rows. When the number of rows Tableau can load into memory is exceeded, an error displays. In this case, use the Select Schema Levels dialog box to reduce the number of selected schema levels.
A data source that contains more than 100 levels of JSON objects can take a long time to load.
A high number of levels creates a lot of columns, which can take a long time to process. As an example, 100 levels can take more than two minutes to load the data. As a best practice, reduce the number of schema levels to just the levels that you need for your analysis.
A single JSON object cannot exceed 128 MB.
When a single object top-level array exceeds 128 MB, you must convert it to a file where the JSON objects are defined one per line.
The pivot option is not supported.
关于 TTDE 和 HHYPER 文件
在浏览计算机目录时,您可能会注意到 .ttde 或 .hhyper 文件。创建连接到数据的 Tableau 数据源时,Tableau 会创建一个 .ttde 或 .hhyper 文件。此文件也称为卷影数据提取,用于帮助提高数据源在 Tableau Desktop 中的加载速度。尽管影子数据提取包含与标准 Tableau 数据提取类似的基础数据和其他信息,但影子数据提取以不同的格式保存,不能用于恢复数据。
在某些情况下,您可能需要从计算机中删除影子数据提取。有关详细信息,请参阅 Tableau 知识库中的由于影子提取而导致的磁盘空间不足。