


 400 998 0226
 Tableau


 Tableau
 Minitab


 Alteryx


 Neo4j
Neo4j


 Talend


 IM
IM


 华为云
华为云 腾讯云
腾讯云 IT/安全
IT/安全


Lift a chestnut! Tableau Trise (125): Drilling Relief under Filter
In the actual business scene, we often need to view the lower level of the dimension through the diamond. For example, when you want to view the subcategory sales under the category, click the plus number on the "Category" capsule, the chart will present all subcategories details.
But if you want to view the situation of a specific subclass, especially in the map application, what should I do without a drilling axis? You can try the filter!
As shown in the figure below, in the same worksheet, the dimension switching drill is performed by the filter.
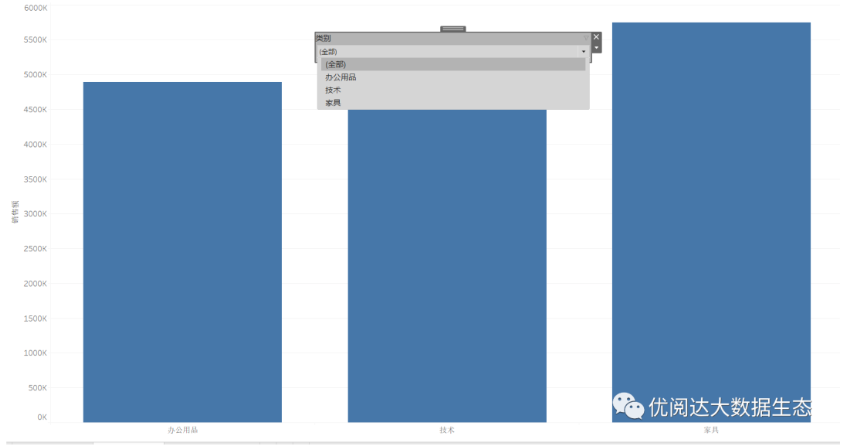
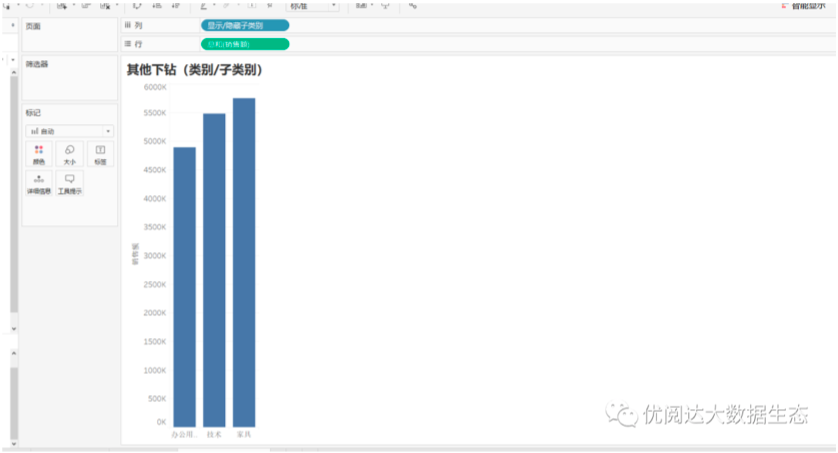
Select all, chart presentation "Category" dimensions
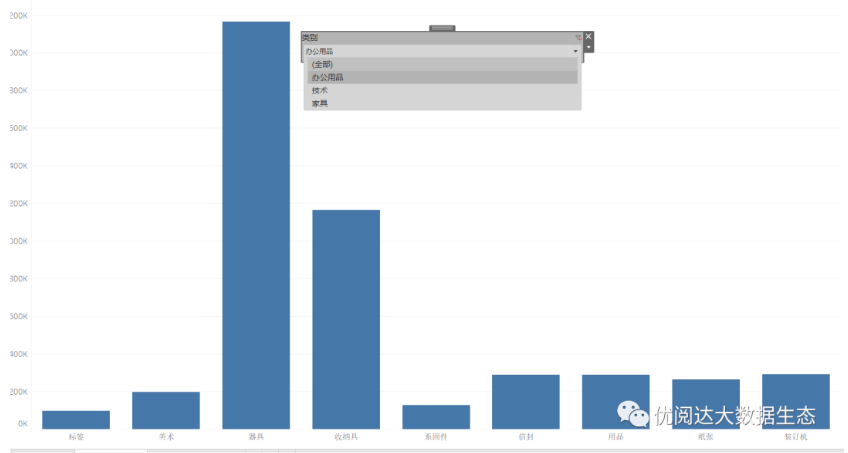
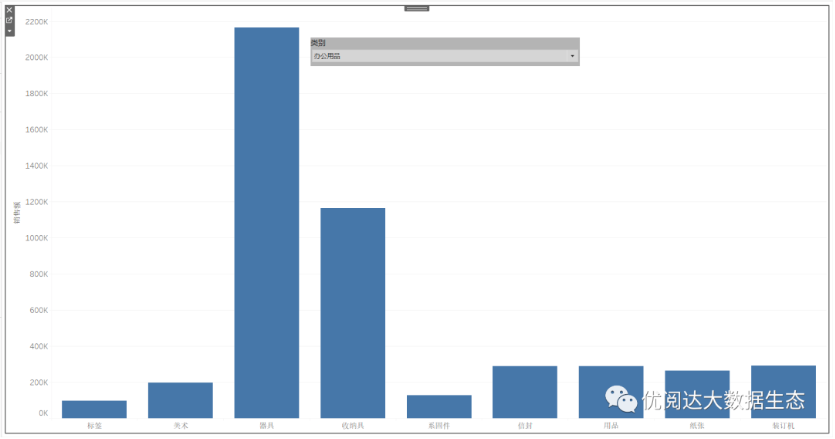
Select technology, furniture or office supplies, chart present specific "subcategory" dimensions
Today, we will share it in Tableau, how to achieve the visualization effect of the drill through the filter.
The Tableau tricks we have to share with you this issue are: Use the filter to drilling under the filter.
For easy learning, chestnuts use Tableau to own supermarket data sources. After mastering the chestnut method, the data powder can try to use other data sources.
Specific steps are as follows:
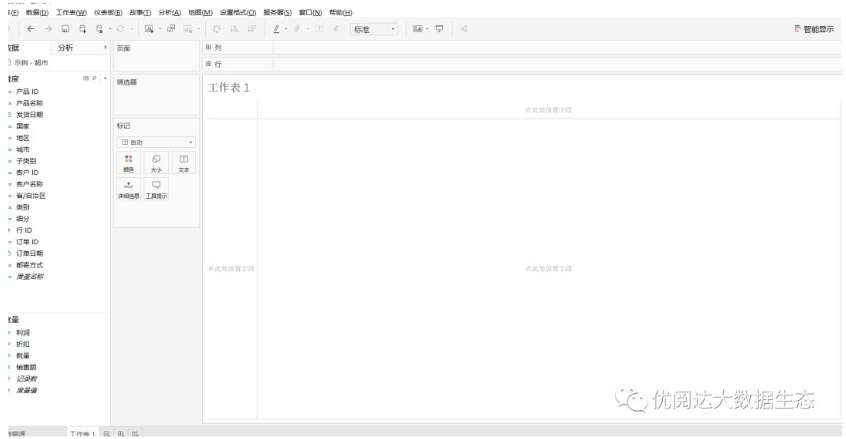
1. First, open Tableau Desktop, connect "Example - Supermarket" data source. Then, create a new worksheet.
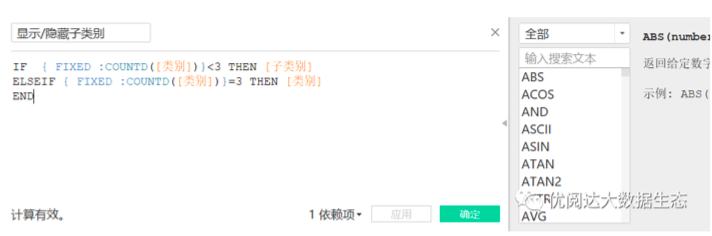
2. Create a calculation field "Show / Hidden Subcarrelation", if the current dimension (category) is less than 3, display the subcategory; if the current dimension (category) is equal to 3, the display category is displayed.
The typing function is as follows:
If {fixed: countd ([category])} ️️ Then [subcategory]
Elseif {Fixed: countd ([category])} = 3 THEN [Category]
end
3, then drag and drop the metrics "Sales" to drag and drop the newly created calculation field "Show / Hidden Subcarrelation".
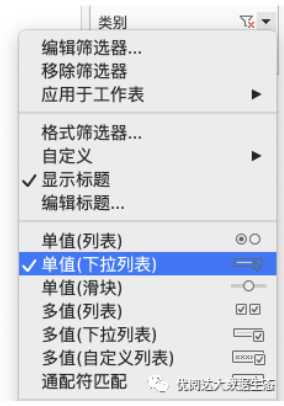
Drag and drop the dimension "Category" to the filter, click the Category capsule on the filter, check "Show Filters" and "Add to Context".

Then, click the "Category" filter right side of the Worksheet view to check the "single value (drop-down list)".
In this way, we have completed the presentation of drilling degrees under the filter. You can also drag and drop the worksheet to the dashboard, and the drill is more intuitive.
This issue of Tableau skills, have you get? Try it quickly!