


 Tableau


 Tableau
 Minitab


 Alteryx


 Neo4j
Neo4j


 Talend


 IM
IM


 华为云
华为云 腾讯云
腾讯云 IT/安全
IT/安全


教程:生成条形图
- 版本 :2023.1(当前版本)
教程:生成条形图
本教程介绍如何开发一个以简单条形图的形式显示数据的 Power BI 视觉对象。 此视觉对象支持最小量的自定义。 本文档的其他页面介绍了如何添加进一步自定义,如上下文菜单、工具提示等。
在本教程中,你将了解:
定义视觉对象的功能
了解用于生成视觉对象的源代码
呈现视觉对象
将对象添加到“属性”窗格中
打包视觉对象
设置环境
在开始开发 Power BI 视觉对象之前,请验证本部分中是否已列出所有内容。
Power BI Pro 或 Premium Per User (PPU) 帐户 。 如果没有订阅密钥,可以注册免费试用版。
Visual Studio Code (VS Code)。 VS Code 是用于开发 JavaScript 和 TypeScript 应用程序的理想集成开发环境 (IDE)。
Windows PowerShell 版本 4 或更高版本(适用于 Windows)。 或终端(适用于 OSX)。
准备好开发 Power BI 视觉对象的环境。 设置用于开发 Power BI 视觉对象的环境。
本教程使用“美国销售额分析”报表。 你可以下载此报表并将其上传到 Power BI 服务,或使用自己的报表。 如果需要有关 Power BI 服务和上传文件的详细信息,请参阅开始在 Power BI 服务中创建教程。
备注
如果未在安装过程中安装 D3 JavaScript 库,请立即安装。 从 PowerShell 运行 npm i d3@latest --save
创建条形图视觉对象涉及以下步骤:
创建新项目
定义 capabilities 文件 -
capabilities.json创建视觉对象 API
打包视觉对象 - pbiviz.json
创建新项目
本教程的目的是帮助你了解视觉对象的架构方式和编写方式。 可按照这些说明从头开始创建一个条码视觉对象,或者可克隆源代码存储库,并使用它来继续进行操作,而无需创建自己的视觉对象。
创建新的视觉对象
克隆源代码
打开 PowerShell 并导航到要在其中创建项目的文件夹。 输入以下命令: PowerShell 现在,你应该有一个名为 BarChart 的文件夹,其中包含视觉对象的文件。 在 VS Code 中,打开 [tsconfig.json](visual-project-structure.md#tsconfigjson) 文件,将“files”的名称更改为“src/barChart.ts”。 TypeScript复制 tsconfig.json 的“files”对象指向视觉对象的主类所在的文件。 最终的 tsconfig.js文件应如此所示。 package.json 文件包含一系列项目依赖项。 将 project.json 文件替换为此文件。pbiviz new BarChart"files": ["src/barChart.ts"]
现在,你应该有一个包含以下文件和文件夹的新视觉对象文件夹:
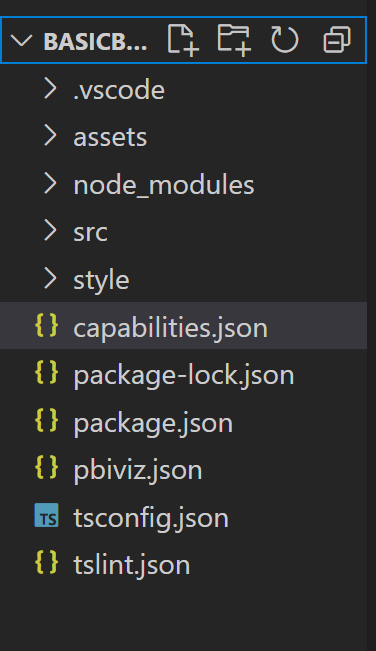
有关其中每个文件的功能的详细说明,请参阅 Power BI 视觉对象项目结构。
本教程将重点介绍的两个文件是 capabilities.json 文件和 src/barchart.ts 文件(前者描述了主机的视觉对象,后者包含视觉对象的 API) 。
定义功能
capabilities.json 文件是将数据绑定到主机的位置。 我们将介绍它接受的数据字段类型,以及视觉对象应该具有的功能。
定义数据角色
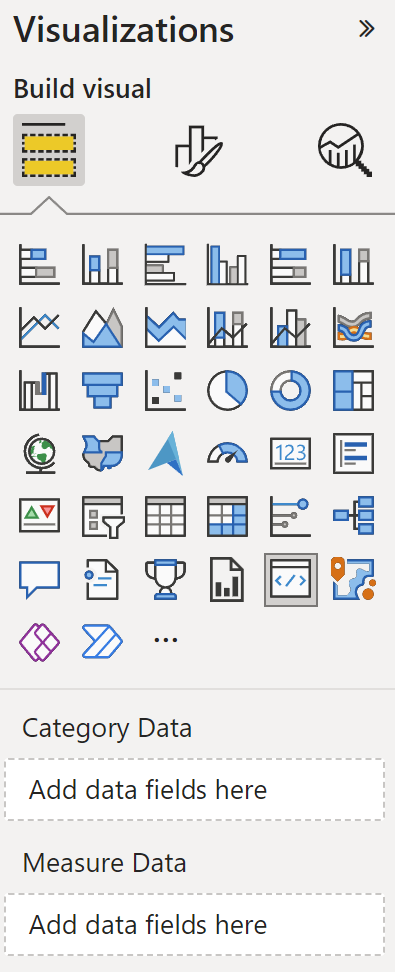
变量在 capabilities 文件的 dataRoles 部分中定义和绑定。 我们希望条形图接受两种类型的变量:
分类数据,由图上不同的条表示
数值或测量数据,由每个条的高度表示
在 Visual Studio Code 中的 capabilities.json 文件中,确认以下 JSON 片段出现在标记为“dataRoles”的对象中。
JSON
    "dataRoles": [
        {            "displayName": "Category Data",            "name": "category",            "kind": "Grouping"
        },
        {            "displayName": "Measure Data",            "name": "measure",            "kind": "Measure"
        }
    ],
映射数据
接下来,添加数据映射,告知主机如何处理这些变量:
将“dataViewMappings”对象的内容替换为以下代码:
JSON
"dataViewMappings": [
        {            "conditions": [
                {                    "category": {                        "max": 1
                    },                    "measure": {                        "max": 1
                    }
                }
            ],            "categorical": {                "categories": {
              "for": {                        "in": "category"
                    }
                },                "values": {                    "select": [
                        {                            "bind": {
                                                       "to": "measure"
                            }
                        }
                    ]
                }
            }
        }
    ],
上述代码创建了每个数据角色对象一次只能保存一个字段的“条件”。 注意,我们使用数据角色的内部 name 引用每个字段。
它还设置分类数据映射,使每个字段映射到正确的变量。
定义“属性”窗格的对象
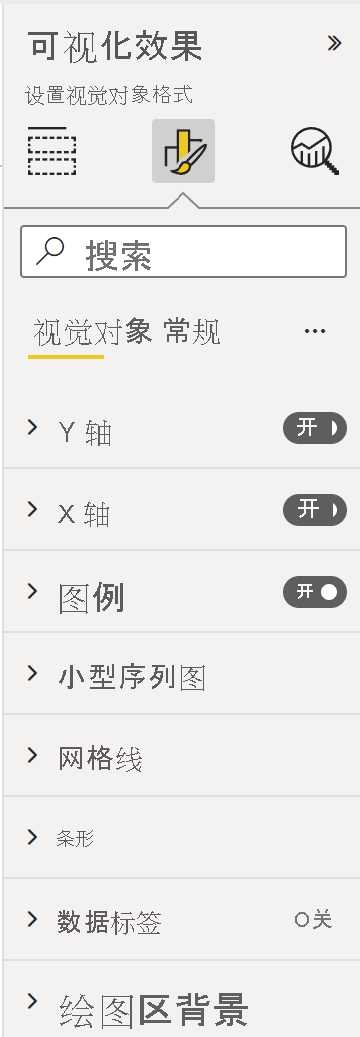
capabilities 文件的“objects”部分是定义应该出现在“格式”窗格上的可定制功能的位置。 这些功能不会影响图的内容,但可以更改其观感。
有关对象及其工作方法详细信息,请参阅对象。
以下对象是可选对象。 如果要完成本教程的可选部分以添加颜色和呈现 X 轴,请添加它们。
将“objects”部分的内容替换为以下代码:
JSON
     "objects": {        "enableAxis": {            "properties": {
                   "show": {                    "type": {
                                         "bool": true
                    }
                },                "fill": {
                                   "type": {

                                     "fill": {
                                                                 "solid": {
                                                      "color": true
                            }
                        }
                    }
                }
            }
        }
     },
保存“capabilities.json”文件。
最终的 capabilities 文件应该类似于此示例中的文件。
视觉对象 API
所有视觉对象都以实现 IVisual 接口的类开头。 src/visual.ts 文件是包含该类的默认文件。
在本教程中,我们将 IVisual 文件称为“barChart.ts”。 下载该文件并将其保存到 /src 文件夹(如果尚未这样做)。 本部分将详细介绍此文件,并描述其各个部分。
导入
文件的第一个部分导入了该视觉对象所需的模块。 请注意,除了 Power BI 视觉对象模块之外,我们还导入了 d3 库。
以下模块将导入到 barChart.ts 文件:
TypeScript复制
import {
    scaleBand, scaleLinear
} from "d3-scale";import {
    select as d3Select
} from "d3-selection";import "./../style/visual.less";
import { axisBottom } from "d3-axis";import powerbiVisualsApi from "powerbi-visuals-api";
import "regenerator-runtime/runtime";import powerbi = powerbiVisualsApi;type Selection = d3.Selectionany, T1, any, T2>;
import DataViewCategoryColumn = powerbi.DataViewCategoryColumn;
import DataViewObjects = powerbi.DataViewObjects;import Fill = powerbi.Fill;
import ISandboxExtendedColorPalette = powerbi.extensibility.ISandboxExtendedColorPalette;
import ISelectionId = powerbi.visuals.ISelectionId;import IVisual = powerbi.extensibility.IVisual;
import IVisualHost = powerbi.extensibility.visual.IVisualHost;
import PrimitiveValue = powerbi.PrimitiveValue;
import VisualUpdateOptions = powerbi.extensibility.visual.VisualUpdateOptions;
import VisualConstructorOptions = powerbi.extensibility.visual.VisualConstructorOptions;
import { textMeasurementService } from "powerbi-visuals-utils-formattingutils";
import { dataViewWildcard } from "powerbi-visuals-utils-dataviewutils";
import { getCategoricalObjectValue, getValue } from "./objectEnumerationUtility";
界面
接下来,定义 viewmodel 接口。 以下三个接口用于描述条形图视觉对象:
BarChartDataPoint
BarChartViewModel
BarChartSettings
这些接口定义如下:
TypeScript复制
/**
 * Interface for BarCharts viewmodel.
 *
 * @interface
 * @property {BarChartDataPoint[]} dataPoints - Set of data points the visual will render.
 * @property {number} dataMax                 - Maximum data value in the set of data points.
 */interface BarChartViewModel {
    dataPoints: BarChartDataPoint[];
    dataMax: number;
    settings: BarChartSettings;
}/**
 * Interface for BarChart data points.
 *
 * @interface
 * @property {number} value             - Data value for point.
 * @property {string} category          - Corresponding category of data value.
 * @property {string} color             - Color corresponding to data point.
 * @property {ISelectionId} selectionId - Id assigned to data point for cross filtering
 *                                        and visual interaction.
 */interface BarChartDataPoint {
    value: PrimitiveValue;
    category: string;
    color: string;
    strokeColor: string;
    strokeWidth: number;
    selectionId: ISelectionId;
}/**
 * Interface for BarChart settings.
 *
 * @interface
 * @property {{show:boolean}} enableAxis - Object property that allows axis to be enabled.
*/interface BarChartSettings {
    enableAxis: {
        show: boolean;
        fill: string;
    };
}let defaultSettings: BarChartSettings = {
    enableAxis: {
        show: false,
        fill: "#000000",
    }
};
视觉对象转换
定义数据结构后,需要使用 visualTransform 函数将数据映射到数据结构上。 此函数从数据视图接收数据,并将数据转换为视觉对象可使用的格式。 在本例中,它返回上述 BarChartViewModel 接口。
DataView 包含要可视化的数据。 此数据可采用不同的形式,例如分类形式或表格形式。 若要生成类似于条形图的分类视觉对象,使用 DataView 上的“分类”属性。
每当视觉对象更新时,都会调用此函数。
TypeScript复制
/**
 * Function that converts queried data into a viewmodel that will be used by the visual.
 *
 * @function
 * @param {VisualUpdateOptions} options - Contains references to the size of the container
 *                                        and the dataView which contains all the data
 *                                        the visual had queried.
 * @param {IVisualHost} host            - Contains references to the host which contains services
 */function visualTransform(options: VisualUpdateOptions, host: IVisualHost): BarChartViewModel {    let dataViews = options.dataViews;    let viewModel: BarChartViewModel = {
        dataPoints: [],
        dataMax: 0,
        settings: {}
    };    if (!dataViews
        || !dataViews[0]
        || !dataViews[0].categorical
        || !dataViews[0].categorical.categories
        || !dataViews[0].categorical.categories[0].source
        || !dataViews[0].categorical.values
    ) {        return viewModel;
    }    let categorical = dataViews[0].categorical;    let category = categorical.categories[0];
        let dataValue = categorical.values[0];    let barChartDataPoints: BarChartDataPoint[] = [];
            let dataMax: number;    let colorPalette: ISandboxExtendedColorPalette = host.colorPalette;
                let objects = dataViews[0].metadata.objects;    const strokeColor: string = getColumnStrokeColor(colorPalette);
                    let barChartSettings: BarChartSettings = {
        enableAxis: {
            show: getValueboolean>(objects, 'enableAxis', 'show', defaultSettings.enableAxis.show),
            fill: getAxisTextFillColor(objects, colorPalette, defaultSettings.enableAxis.fill),
        }
    };    const strokeWidth: number = getColumnStrokeWidth(colorPalette.isHighContrast);
       for (let i = 0, len = Math.max(category.values.length, dataValue.values.length);
        i const color: string = getColumnColorByIndex(category, i, colorPalette);
              const selectionId: ISelectionId = host.createSelectionIdBuilder()
            .withCategory(category, i)
            .createSelectionId();

        barChartDataPoints.push({
            color,
            strokeColor,
            strokeWidth,
            selectionId,
            value: dataValue.values[i],
            category: `${category.values[i]}`,
        });
    }

    dataMax = number>dataValue.maxLocal;    return {
        dataPoints: barChartDataPoints,
        dataMax: dataMax,
        settings: barChartSettings,
    };
}
备注
barChart.ts 文件中接下来的几个函数处理颜色和创建 X 轴。 这些是可选的函数,将在本教程中进一步讨论。 本教程将从 IVisual 函数继续。
呈现视觉对象
定义数据后,我们使用实现 IVisual 接口的 BarChart 类呈现视觉对象。 视觉对象 API 页上介绍了 IVisual 接口。 它包含一个创建视觉对象的 constructor 方法,以及一个每次视觉对象重载都会调用的 update 方法。 在呈现视觉对象之前,必须声明类的成员:
TypeScript复制
export class BarChart implements IVisual {
    private svg: Selectionany>;
    private host: IVisualHost;
    private barContainer: Selection;
        private xAxis: Selection;
        private barDataPoints: BarChartDataPoint[];
            private barChartSettings: BarChartSettings;
                private barSelection: d3.Selectionany, d3.BaseType, any>;
                   static Config = {
        xScalePadding: 0.1,
        solidOpacity: 1,
        transparentOpacity: 1,
        margins: {
            top: 0,
            right: 0,
            bottom: 25,
            left: 30,
        },
        xAxisFontMultiplier: 0.04,
    }
 }
构造视觉对象
首次呈现视觉对象时,只调用一次构造函数。 它为条形图和 X 轴创建空的 SVG 容器。 注意,它使用 d3 库来呈现 SVG。
TypeScript
/**
     * Creates instance of BarChart. This method is only called once.
     *
     * @constructor
     * @param {VisualConstructorOptions} options - Contains references to the element that will
     *                                             contain the visual and a reference to the host
     *                                             which contains services.
     */
    constructor(options: VisualConstructorOptions) {        this.host = options.host;        this.svg = d3Select(options.element)
            .append('svg')
            .classed('barChart', true);        this.barContainer = this.svg
            .append('g')
            .classed('barContainer', true);        this.xAxis = this.svg
            .append('g')
            .classed('xAxis', true);
    }
更新视觉对象
每次视觉对象的大小或它的一个值发生更改时,都会调用 update 方法。
缩放
需缩放视觉对象,使条数和当前值适合视觉对象的定义宽度和高度限制。 这类似于教程中的 update 方法。
为了计算规模,我们使用之前从 d3-scale 库中导入的 scaleLinear 和 scaleBand 方法。
viewModel.datamax 值保留所有当前数据点的最大值。 此值用于确定 Y 轴的高度。 X 轴宽度的缩放由 barchartdatapoint 接口中绑定到视觉对象的类别数决定。
对于呈现 X 轴的情况,此视觉对象还会处理断字,以防没有足够的空间在 X 轴上写出整个名称。
其他更新功能
除了缩放外,此 update 方法还会处理所选项和颜色。 这些功能是可选功能,稍后将进行讨论:
TypeScript复制
   /**
     * Updates the state of the visual. Every sequential databinding and resize will call update.
     *
     * @function
     * @param {VisualUpdateOptions} options - Contains references to the size of the container
     *                                        and the dataView which contains all the data
     *                                        the visual had queried.
     */
    public update(options: VisualUpdateOptions) {
           let viewModel: BarChartViewModel = visualTransform(options, this.host);
                   let settings = this.barChartSettings = viewModel.settings;
                           this.barDataPoints = viewModel.dataPoints;
                                  let width = options.viewport.width;
                                          let height = options.viewport.height;
                                                  this.svg
            .attr("width", width)
            .attr("height", height);
                    if (settings.enableAxis.show) {
                        let margins = BarChart.Config.margins;
            height -= margins.bottom;
        }        this.xAxis
            .style("font-size", Math.min(height, width) * BarChart.Config.xAxisFontMultiplier)
            .style("fill", settings.enableAxis.fill);
                   let yScale = scaleLinear()
            .domain([0, viewModel.dataMax])
            .range([height, 0]);        let xScale = scaleBand()
            .domain(viewModel.dataPoints.map(d => d.category))
            .rangeRound([0, width])
            .padding(0.2);
                   let xAxis = axisBottom(xScale);
                   const colorObjects = options.dataViews[0] ? options.dataViews[0].metadata.objects : null;
                           this.xAxis.attr('transform', 'translate(0, ' + height + ')')
            .call(xAxis)
            .attr("color", getAxisTextFillColor(
                colorObjects,                this.host.colorPalette,
                defaultSettings.enableAxis.fill
            ));        const textNodes = this.xAxis.selectAll("text")
        BarChart.wordBreak(textNodes, xScale.bandwidth(), height);        this.barSelection = this.barContainer
            .selectAll('.bar')
            .data(this.barDataPoints);        const barSelectionMerged = this.barSelection
            .enter()
            .append('rect')
            .merge(any>this.barSelection);

        barSelectionMerged.classed('bar', true);

        barSelectionMerged
            .attr("width", xScale.bandwidth())
            .attr("height", d => height - yScale(number>d.value))
            .attr("y", d => yScale(number>d.value))
            .attr("x", d => xScale(d.category))
            .style("fill", (dataPoint: BarChartDataPoint) => dataPoint.color)
            .style("stroke", (dataPoint: BarChartDataPoint) => dataPoint.strokeColor)
            .style("stroke-width", (dataPoint: BarChartDataPoint) => `${dataPoint.strokeWidth}px`);
                   this.barSelection
            .exit()
            .remove();

    }    private static wordBreak(
        textNodes: Selectionany, SVGElement>,
        allowedWidth: number,
        maxHeight: number
    ) {
        textNodes.each(function () {
            textMeasurementService.wordBreak(                this,
                allowedWidth,
                maxHeight);
        });
    }
填充“属性”窗格
IVisual 函数中的最后一个方法是 getFormattingModel。 此方法生成并返回包含所有格式窗格组件和属性的新式“格式窗格格式设置模型”对象。 然后,它将对象置于“格式”窗格中。 在本例中,我们将根据 capabilities.json 文件中的“对象”创建 enableAxis 和 colorSelector 的格式卡片,其中包括 show 和 fill 的格式设置属性。
若要生成格式设置模型,开发人员应熟悉其所有组件,查看“格式”窗格中格式窗格的组件。
若要在“属性”窗格中为每个类别添加颜色选取器,请在 barDataPoints 上添加一个 for 循环,并为每个类别向格式设置模型添加新的颜色选取器格式属性。
TypeScript复制
    /** Gets the settings to display in the formatting pane */
    public getFormattingModel(): powerbi.visuals.FormattingModel {
            const enableAxisCard: powerbi.visuals.FormattingCard = {
            displayName: "Enable Axis",
            uid: "enableAxisCard_uid",
            topLevelToggle: {
                uid: "enableAxisCard_topLevelToggle_showToggleSwitch_uid",
                suppressDisplayName: true,
                control: {                    type: powerbi.visuals.FormattingComponent.ToggleSwitch,
                    properties: {
                        descriptor: {
                            objectName: "enableAxis",
                            propertyName: "show"
                        },
                        value: this.barChartSettings.enableAxis.show
                    }
                }
            },
            groups: [{
                displayName: undefined,
                uid: "enableAxisCard_group1_uid",
                slices: [
                    {
                        uid: "enableAxisCard_group1_fill_uid",
                        displayName: "Color",
                        control: {
                                                    type: powerbi.visuals.FormattingComponent.ColorPicker,
                            properties: {
                                descriptor: {
                                    objectName: "enableAxis",
                                    propertyName: "fill"
                                },
                                value: { value: this.barChartSettings.enableAxis.fill }
                            }
                        }
                    }
                ],
            }],
            revertToDefaultDescriptors: [
                {
                    objectName: "enableAxis",
                    propertyName: "show"
                },
                {
                    objectName: "enableAxis",
                    propertyName: "fill"
                }
            ]
        };        const colorSelectorCard: powerbi.visuals.FormattingCard = {
            displayName: "Data Colors",
            uid: "dataColorsCard_uid",
            groups: [{
                displayName: undefined,
                uid: "dataColorsCard_group_uid",

                slices: [],
            }]
        };        if (this.barDataPoints) {
                   let indx = 1;
                              this.barDataPoints.forEach(dataPoint => {
                (colorSelectorCard.groups[0] as powerbi.visuals.FormattingGroup).slices.push(
                    {
                        uid: `dataColorsCard_group_colorSelector${indx}_uid`,
                        displayName: dataPoint.category,
                        control: {
                                                    type: powerbi.visuals.FormattingComponent.ColorPicker,
                            properties: {
                                descriptor: {
                                    objectName: "colorSelector",
                                    propertyName: "fill",
                                    selector: dataViewWildcard.createDataViewWildcardSelector(dataViewWildcard.DataViewWildcardMatchingOption.InstancesAndTotals),
                                    altConstantValueSelector: dataPoint.selectionId.getSelector(),
                                    instanceKind: powerbi.VisualEnumerationInstanceKinds.ConstantOrRule
                                },
                                value: { value: dataPoint.color }
                            }
                        }
                    });
            });

            colorSelectorCard.revertToDefaultDescriptors = [
                {
                    objectName: "colorSelector",
                    propertyName: "fill"
                }
            ]
        }        return { cards: [enableAxisCard, colorSelectorCard] };
    }
(可选)使用格式模型 Utils 填充属性窗格
使用格式设置模型 utils 存储库中的 getFormattingModel API 填充属性窗格
有关包含格式设置模型 utils 的示例条形图的完整代码,请参阅条形图存储库。
在格式设置类中声明格式设置属性及其值:
TypeScript复制
import powerbi from "powerbi-visuals-api";
import { dataViewWildcard } from "powerbi-visuals-utils-dataviewutils";
import { formattingSettings } from "powerbi-visuals-utils-formattingmodel";
import { BarChartDataPoint } from "./barChart";
import FormattingSettingsCard = formattingSettings.Card;
import FormattingSettingsSlice = formattingSettings.Slice;import FormattingSettingsModel = formattingSettings.Model;/**
 * Enable Axis Formatting Card
 */class EnableAxisCardSettings extends FormattingSettingsCard {    // Formatting property `show` toggle switch (formatting simple slice)
    show = new formattingSettings.ToggleSwitch({
        name: "show",
        displayName: undefined,
        value: false,
        topLevelToggle: true
    });    // Formatting property `fill` color picker (formatting simple slice)
    fill = new formattingSettings.ColorPicker({
        name: "fill",
        displayName: "Color",
        value: { value: "#000000" }
    });

    name: string = "enableAxis";
    displayName: string = "Enable Axis";
    slices: Array = [this.show, this.fill];
}/**
 * Color Selector Formatting Card
 */class ColorSelectorCardSettings extends FormattingSettingsCard {
    name: string = "colorSelector";
    displayName: string = "Data Colors";
    // slices will be populated in barChart settings model `populateColorSelector` method
    slices: Array = [];
}/**
* BarChart settings model class
*
*/export class BarChartSettingsModel extends FormattingSettingsModel {
// Create formatting settings model formatting cards
    enableAxis = new EnableAxisCardSettings();
    colorSelector = new ColorSelectorCardSettings();
    cards = [this.enableAxis, this.colorSelector];    /**
     * populate colorSelector object categories formatting properties
     * @param dataPoints
     */
    populateColorSelector(dataPoints: BarChartDataPoint[]) {        let slices = this.colorSelector.slices;        if (dataPoints) {
            dataPoints.forEach(dataPoint => {
                slices.push(new formattingSettings.ColorPicker({
                    name: "fill",
                    displayName: dataPoint.category,
                    value: { value: dataPoint.color },
                    selector: dataViewWildcard.createDataViewWildcardSelector(dataViewWildcard.DataViewWildcardMatchingOption.InstancesAndTotals),
                    altConstantSelector: dataPoint.selectionId.getSelector(),
                    instanceKind: powerbi.VisualEnumerationInstanceKinds.ConstantOrRule
                }));
            });
        }
    }
}
在视觉对象的构造函数方法中生成和创建格式设置服务模型。 格式设置服务接收 barChart 格式设置,并将其转换为 getFormattingModel API 中返回的 FormattingModel 对象。
若要使用本地化功能,请将本地化管理器添加到格式设置服务。
TypeScript复制
    import { FormattingSettingsService } from "powerbi-visuals-utils-formattingmodel";
    // ...
    // declare utils formatting settings service
    private formattingSettingsService: FormattingSettingsService;    //...

    constructor(options: VisualConstructorOptions) {        this.host = options.host;        const localizationManager = this.host.createLocalizationManager();        this.formattingSettingsService = new FormattingSettingsService(localizationManager);
        // Add here rest of your custom visual constructor code
    }
使用更新 API 更新格式化设置模型。 每次更改属性窗格中的格式设置属性时都调用更新 API。 创建条形图选择器数据点,并在格式化设置模型中填充它们:
TypeScript复制
    // declare formatting settings model for bar chart
    private formattingSettings: BarChartSettingsModel;    // ...

    public update(options: VisualUpdateOptions) {
    this.formattingSettings = this.formattingSettingsService.populateFormattingSettingsModel(BarChartSettingsModel, options.dataViews);
    this.barDataPoints = createSelectorDataPoints(options, this.host);
    this.formattingSettings.populateColorSelector(this.barDataPoints);
     // Add the rest of your custom visual update API code here

    }
最后,新 API getFormattingModel 是一个简单的代码行,它使用在上述更新 API 中创建的格式设置服务和当前格式设置模型。
TypeScript复制
    public getFormattingModel(): powerbi.visuals.FormattingModel {
    return this.formattingSettingsService.buildFormattingModel(this.formattingSettings);
    }
(可选)呈现 X 轴(静态对象)
可以将对象添加到“属性”窗格中以进一步自定义视觉对象。 这些自定义项可以是用户界面更改,或与查询的数据相关的更改。
可在“属性”窗格中打开或关闭这些对象。
此示例将条形图上的 X 轴呈现为静态对象。
我们已将 enableAxis 属性添加到 capabilities 文件和 barChartSettings 接口。 将以下代码添加到 barChart.ts 文件中的 iVisual 类之前,以绘制 X 轴 :
TypeScript复制
function getAxisTextFillColor(
    objects: DataViewObjects,
    colorPalette: ISandboxExtendedColorPalette,
    defaultColor: string): string {    if (colorPalette.isHighContrast) {        return colorPalette.foreground.value;
    }    return getValue(
        objects,        "enableAxis",        "fill",
        {
            solid: {
                color: defaultColor,
            }
        },
    ).solid.color;
}
(可选)添加颜色(数据绑定对象)
数据绑定对象类似于静态对象,但通常处理数据选择。 例如,可使用数据绑定对象以交互方式选择与每个数据点关联的颜色。
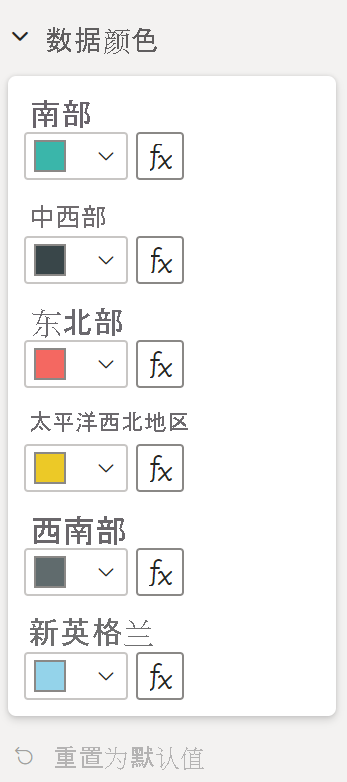
已在 capabilities 文件中定义了 colorSelector 对象。
每个数据点以一种不同颜色表示。 我们在 BarChartDataPoint 接口中包含了颜色,并在 IVisualHost 中定义每个数据点时为其分配了默认颜色。
TypeScript复制
function getColumnColorByIndex(
    category: DataViewCategoryColumn,
    index: number,
    colorPalette: ISandboxExtendedColorPalette,): string {    if (colorPalette.isHighContrast) {        return colorPalette.background.value;
    }    const defaultColor: Fill = {
        solid: {
            color: colorPalette.getColor(`${category.values[index]}`).value,
        }
    };    return getCategoricalObjectValue(
        category,
        index,        'colorSelector',        'fill',
        defaultColor
    ).solid.color;
}function getColumnStrokeColor(colorPalette: ISandboxExtendedColorPalette): string {    return colorPalette.isHighContrast
        ? colorPalette.foreground.value
        : null;
}function getColumnStrokeWidth(isHighContrast: boolean): number {    return isHighContrast
        ? 2
        : 0;
}
visualTransform 函数中的 colorPalette 服务管理这些颜色。 由于 visualTransform 会循环访问每个数据点,因此它是分配分类对象(如颜色)的理想位置。
有关如何向条形图添加颜色的更详细的说明,请转到向 Power BI 视觉对象添加颜色
备注
验证你的最终 barChart.ts 文件类似于此 barChart.ts 源代码,或者下载 barChart.ts 源代码并用它替换你的文件 。
对象枚举实用工具(可选)
对象属性值作为 dataView 中的元数据提供,但没有可帮助检索这些值的服务。 ObjectEnumerationUtility 是一组可选的静态函数,可循环访问 dataView 并检索对象值。 在 src 文件夹中创建名为 objectEnumerationUtility.ts 的文件,并将以下代码复制到其中:
TypeScript复制
/**
 * Gets property value for a particular object.
 *
 * @function
 * @param {DataViewObjects} objects - Map of defined objects.
 * @param {string} objectName       - Name of desired object.
 * @param {string} propertyName     - Name of desired property.
 * @param {T} defaultValue          - Default value of desired property.
 */export function getValueT>(objects: DataViewObjects, objectName: string, propertyName: string, defaultValue: T ): T {    if(objects) {        let object = objects[objectName];        if(object) {            let property: T = object[propertyName];            if(property !== undefined) {                return property;
            }
        }
    }    return defaultValue;
}/**
 * Gets property value for a particular object in a category.
 *
 * @function
 * @param {DataViewCategoryColumn} category - List of category objects.
 * @param {number} index                    - Index of category object.
 * @param {string} objectName               - Name of desired object.
 * @param {string} propertyName             - Name of desired property.
 * @param {T} defaultValue                  - Default value of desired property.
 */export function getCategoricalObjectValueT>(category: DataViewCategoryColumn, index: number, objectName: string, propertyName: string, defaultValue: T): T {    let categoryObjects = category.objects;    if (categoryObjects) {        let categoryObject: DataViewObject = categoryObjects[index];        if (categoryObject) {            let object = categoryObject[objectName];            if (object) {                let property: T = object[propertyName];                if (property !== undefined) {                    return property;
                }
            }
        }
    }    return defaultValue;
}
函数 getCategoricalObjectValue 提供一种通过属性的类别索引访问属性的简便方法。 你必须提供与 capabilities.json 中的对象和属性匹配的 objectName 和 propertyName。
请参阅 objectEnumerationUtility.ts,获取源代码。
测试视觉对象
在 Power BI Server 中运行视觉对象,查看其外观:
在 PowerShell 中,导航到项目的文件夹并启动开发应用。
PowerShell复制
pbiviz start托管在计算机上的视觉对象现在正在运行。
重要
在本教程结束之前,请不要关闭 PowerShell 窗口。 若要停止运行视觉对象,请输入 Ctrl+C,若系统提示终止批处理作业,请输入 Y,然后按 Enter 。
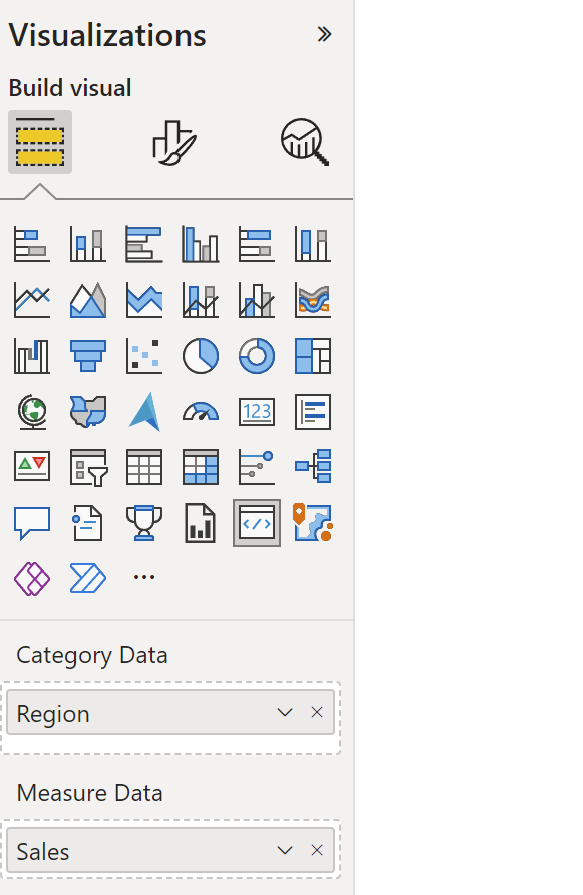
通过从“可视化效果”窗格中选择“开发人员视觉对象”,查看 Power BI 服务中的视觉对象 。
向视觉对象添加数据
拖动视觉对象的边缘可更改大小,并注意规模的调整方式。
打开和关闭 X 轴。

更改不同类别的颜色。
添加其他功能
可通过添加更多功能来进一步自定义视觉对象。 可添加用于增加视觉对象的功能、增强其观感或让用户更好地控制其外观的功能。 例如,你能够:
添加选择并与其他视觉对象交互
添加属性窗格滑块以控制不透明度
添加对工具提示的支持
添加登陆页面
添加本地语言支持
打包视觉对象
将视觉对象加载到 Power BI Desktop 中或者在 Power BI 视觉对象库中与社区共享视觉对象之前,必须将视觉对象打包。
按照打包 Power BI 视觉对象中的说明,准备视觉对象以进行共享。
备注
有关包含更多功能(包括工具提示和上下文菜单)的条形图的完整源代码,请参阅 Power BI 视觉对象示例条形图。