


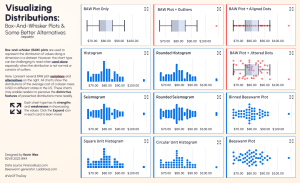
Alternatives to Box Plots: N Ways to Visualize Data Distribution in Tableau
In daily analysis, distribution visualization is one of the most effect...
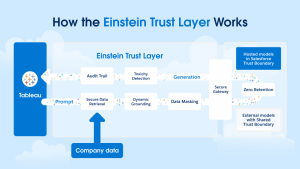
At the release of Tableau 2024.2, the product team announced that Einstein Copilot for Tableau (now updated to Tableau Agent) would launch in August. ...
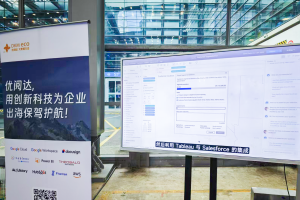
At the recently concluded GTC2024 Global Traffic Conference in Shenzhen, uGreen partnered with Tableau to present an interactive exhibition, drawing s...
When using a spreadsheet for data growth analysis, you need to add a field to the actual comparison result in the table, and then use the function to ...
for data analysis, data analysts need to be reminded:When numerical analysis chart of a parameter exceeds a certain value, Tableau can automatically a...
If you changed a new computer. After installing Tableau, how can I migrate my original license?The right way: After the A computer activation key, if ...